
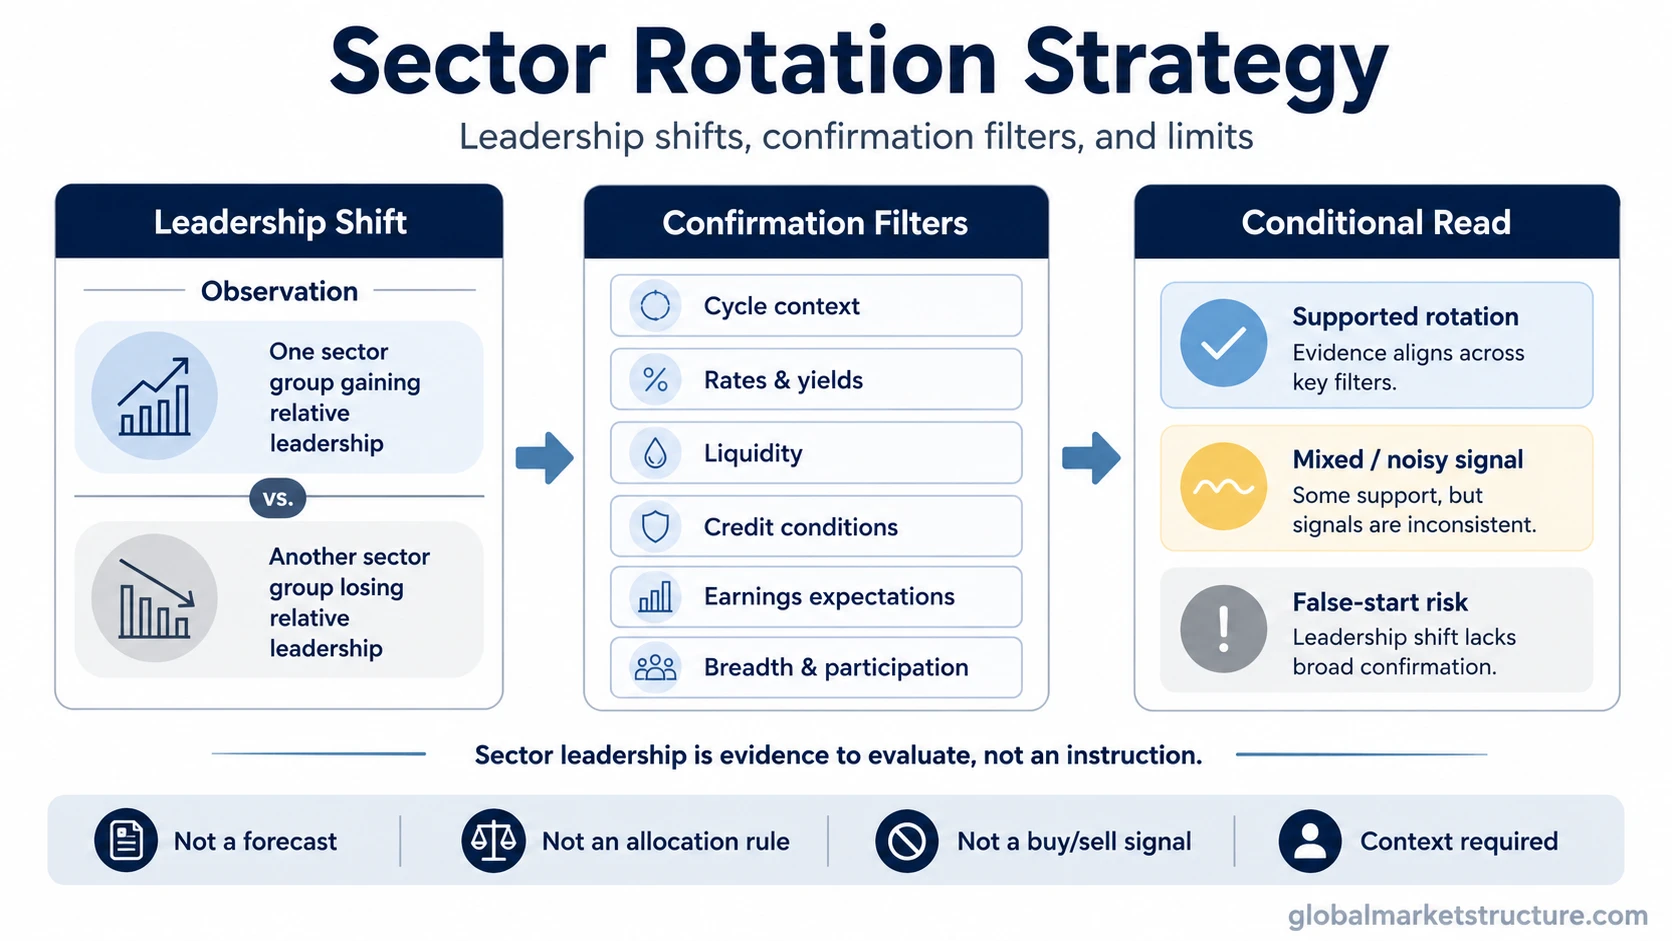
A sector rotation strategy is a framework for interpreting shifts in leadership between market sectors across a market cycle. It compares which sectors are gaining or losing relative strength, then checks whether the move is supported by business-cycle context, rates, liquidity, credit, earnings expectations, breadth, and broader market leadership. By itself, it is not a forecast, allocation command, ETF rule, or buy/sell signal.
What Sector Rotation Strategy Means
Sector rotation describes how leadership can shift from one part of the equity market to another. A sector rotation strategy turns that observation into a structured reading process: identify the leadership shift, test the surrounding evidence, and decide whether the move fits a broader market-cycle interpretation.
The useful distinction is between rotation as evidence and rotation as instruction. A leadership shift can reveal changing risk appetite, changing discount-rate pressure, changing earnings expectations, or changing liquidity conditions. It does not automatically say that one sector should be bought or another should be sold.
Key Points
- Sector rotation strategy reads leadership shifts between sectors as part of a broader market-cycle framework.
- The strongest reads combine sector relative strength with rates, liquidity, credit, earnings revisions, breadth, and leadership quality.
- Cycle maps are useful context, but they become risky when treated as fixed allocation rules.
- False starts are common when one sector group leads without confirmation from breadth, credit, earnings, or broader market participation.
- The framework is most useful for interpretation, not for mechanical sector selection or current-cycle prediction.
How Sector Rotation Strategy Works
A sector rotation strategy starts with relative leadership. If one sector group begins outperforming while another weakens, the first question is not “what should be bought?” The better question is what the leadership shift may be saying about the market environment.
Leadership can change for several reasons. Cyclical groups may strengthen when growth expectations improve. Defensive groups may strengthen when demand stability becomes more valuable. Rate-sensitive industries may respond to falling or rising yields. Growth and value leadership can shift when discount rates, earnings durability, valuation pressure, and risk appetite change.
The framework becomes more useful when the rotation is checked against conditions outside the sector chart. Falling yields, easing liquidity, stable credit spreads, improving earnings revisions, and broader participation can support one interpretation. Tight liquidity, widening credit spreads, weak breadth, and narrow leadership can weaken the same interpretation.
The Sector Rotation Signal Stack
No single signal carries the full interpretation. A sector move becomes more meaningful when multiple pieces of evidence point in the same direction and less reliable when the confirmation stack is mixed.
| Signal | What it can show | What strengthens the read | What weakens the read |
|---|---|---|---|
| Business-cycle context | Whether leadership fits recovery, expansion, slowdown, or contraction pressure | Sector behavior agrees with growth, employment, credit, and earnings trends | Sector leadership conflicts with macro data or changes too quickly to confirm a phase |
| Rates and yields | Whether discount-rate pressure or financing conditions are shaping leadership | Rate-sensitive groups respond consistently with yield direction and curve behavior | Sector moves depend only on yield headlines without credit, earnings, or breadth support |
| Liquidity and credit | Whether risk appetite is supported by funding conditions and credit tolerance | Liquidity conditions improve while credit spreads remain stable or tighten | Credit stress rises while equity leadership appears narrow or defensive |
| Earnings expectations | Whether leadership is supported by forward profit expectations | Relative strength agrees with improving earnings revisions or resilient margins | Price leadership runs ahead of earnings support or depends only on multiple expansion |
| Relative strength | Which sectors are leading or lagging versus the broader market | Leadership persists across timeframes and is not limited to one short price burst | Leadership is late, crowded, or driven by one narrow industry group |
| Breadth | Whether participation is broad or concentrated | More stocks within the leading sectors participate in the move | Only a few large stocks carry the sector while most components lag |
| Leadership quality | Whether the move reflects durable market leadership or temporary defensive positioning | Market leadership broadens and aligns with the broader risk environment | Leadership narrows while broader indices, credit, or earnings quality deteriorate |
Sector Groups Inside the Framework
Sector rotation strategy does not require every sector to be reduced to a fixed cycle label. The same group can behave differently depending on rates, liquidity, earnings expectations, and investor risk preference.
Cyclical sectors are usually more sensitive to economic activity, revenue cycles, capital spending, and risk appetite. Their leadership can support a pro-growth interpretation when credit, liquidity, and earnings evidence also improve.
Defensive sectors often attract attention when demand stability, cash-flow resilience, or lower economic sensitivity becomes more valuable. Their leadership can reflect caution, but it can also reflect falling yields, valuation reset, or earnings resilience.
Style leadership adds another layer. Growth-oriented groups can be more sensitive to discount-rate pressure because more of their expected value may sit further in the future. Value-oriented leadership can reflect valuation discipline, sector mix, earnings cyclicality, or a preference for nearer-term cash flows. That is why growth stocks and value stocks should be read with rates, earnings quality, and liquidity conditions rather than as isolated style labels.
Rate-sensitive groups require special care. A falling-yield backdrop may support some sectors by reducing financing costs or discount-rate pressure, while the same falling yields may also signal growth fear if credit and breadth deteriorate.
Supporting vs Weakening Evidence
A sector rotation read becomes stronger when the leadership shift, macro context, and market internals tell a similar story. For example, cyclical leadership is more meaningful when economic data, earnings revisions, liquidity conditions, credit spreads, and breadth all support a healthier risk environment.
The read weakens when the evidence conflicts. A sector can outperform for temporary reasons, valuation catch-up, defensive positioning, a single large-stock move, or short-lived rate sensitivity. When breadth is narrow, credit spreads are widening, liquidity is tightening, or earnings revisions are deteriorating, the rotation may be less reliable as a cycle signal.
The framework works best as a sequence:
- Identify which sectors or styles are gaining relative strength.
- Check whether the move fits the business-cycle and macro backdrop.
- Test confirmation through rates, liquidity, credit, earnings, breadth, and leadership quality.
- Look for contradiction before treating the move as regime evidence.
- Keep the conclusion conditional when the signal stack is mixed.
Sector Rotation Strategy Example in Context
A common scenario is defensive leadership during a period of falling yields. That move can have more than one interpretation. It may reflect lower discount-rate pressure, a preference for stable earnings, rising growth concern, or early risk-off behavior.
The interpretation changes with surrounding evidence. If credit spreads are calm, breadth is broad, and earnings expectations are stable, defensive leadership may simply reflect yield sensitivity or valuation adjustment. If credit spreads widen, breadth weakens, and cyclical groups lose relative strength, the same defensive leadership may carry a more cautious message.
The practical value is not the sector label by itself. The value comes from comparing the sector move with the broader evidence stack before treating it as a market-cycle signal.
Common Sector Rotation Mistakes
Chasing late leadership: A sector can look strong after much of the move has already occurred. Late leadership is especially risky when breadth narrows or the move depends on a small number of stocks.
Treating cycle maps as fixed rules: Business-cycle sector maps are helpful as orientation tools, but real markets do not move in a perfect textbook sequence. Policy, liquidity, valuation, and earnings expectations can change the order.
Reading relative strength alone: Relative strength can identify leadership, but it does not explain why leadership is happening. Credit, liquidity, rates, breadth, and earnings context are needed before drawing a market-cycle conclusion.
Confusing rotation with ETF picking: Sector ETFs can be used to observe leadership, but the framework is not automatically an ETF allocation system. The analytical question is what the leadership shift says about the market environment.
Assuming one sector proves the cycle phase: Defensive leadership does not automatically prove recession risk, and cyclical leadership does not automatically prove expansion. Confirmation matters more than a single label.
When Sector Rotation Strategy Is Useful and When It Fails
Sector rotation strategy is useful when it clarifies leadership quality. It can help separate broad, confirmed market participation from narrow, temporary, or contradictory leadership. It can also help connect equity market behavior with rates, liquidity, credit, earnings expectations, and risk appetite.
The framework becomes weaker when the signal is narrow, late, crowded, or contradicted by other evidence. A sector can lead because of temporary positioning, a valuation rebound, one large constituent, a policy headline, or short-term rate movement. Without broader confirmation, that leadership may not say much about the market cycle.
Sector rotation can also fail when the market environment changes faster than the framework updates. A leadership shift that looked constructive under stable credit conditions can become less useful if liquidity tightens, spreads widen, earnings expectations fall, or market breadth deteriorates.
How to Read Sector Rotation Without Turning It Into a Signal
The safest use of sector rotation strategy is interpretive. It asks what leadership is saying about the market environment, not what trade should be placed immediately. The distinction matters because the same sector move can carry different meanings under different rate, liquidity, credit, and earnings conditions.
When the evidence is aligned, sector leadership can help confirm a broader regime reading. When the evidence is mixed, it should remain a hypothesis. A conditional conclusion is stronger than a confident claim built from one chart or one cycle map.
For broader cycle-stage context, business cycle sector rotation can help frame how sector behavior is often discussed across recovery, expansion, slowdown, and contraction phases. The strategy layer remains separate because it focuses on how to test the evidence rather than memorizing a fixed sequence.
FAQ
Is sector rotation strategy a buy or sell signal?
No. Sector rotation can provide market-cycle evidence, but it does not automatically create a buy or sell signal. The interpretation depends on confirmation from the broader market environment.
Why can sector rotation give false signals?
False signals can appear when leadership is late, narrow, crowded, liquidity-driven, or unsupported by credit, breadth, earnings, and macro evidence.
How is sector rotation different from business-cycle sector rotation?
Business-cycle sector rotation maps common sector behavior across cycle phases. Sector rotation strategy focuses on testing whether current leadership is confirmed by the wider evidence stack.
Which signals matter most in sector rotation strategy?
The most useful signals are sector relative strength, business-cycle context, rates, liquidity, credit spreads, earnings revisions, market breadth, and leadership quality.