
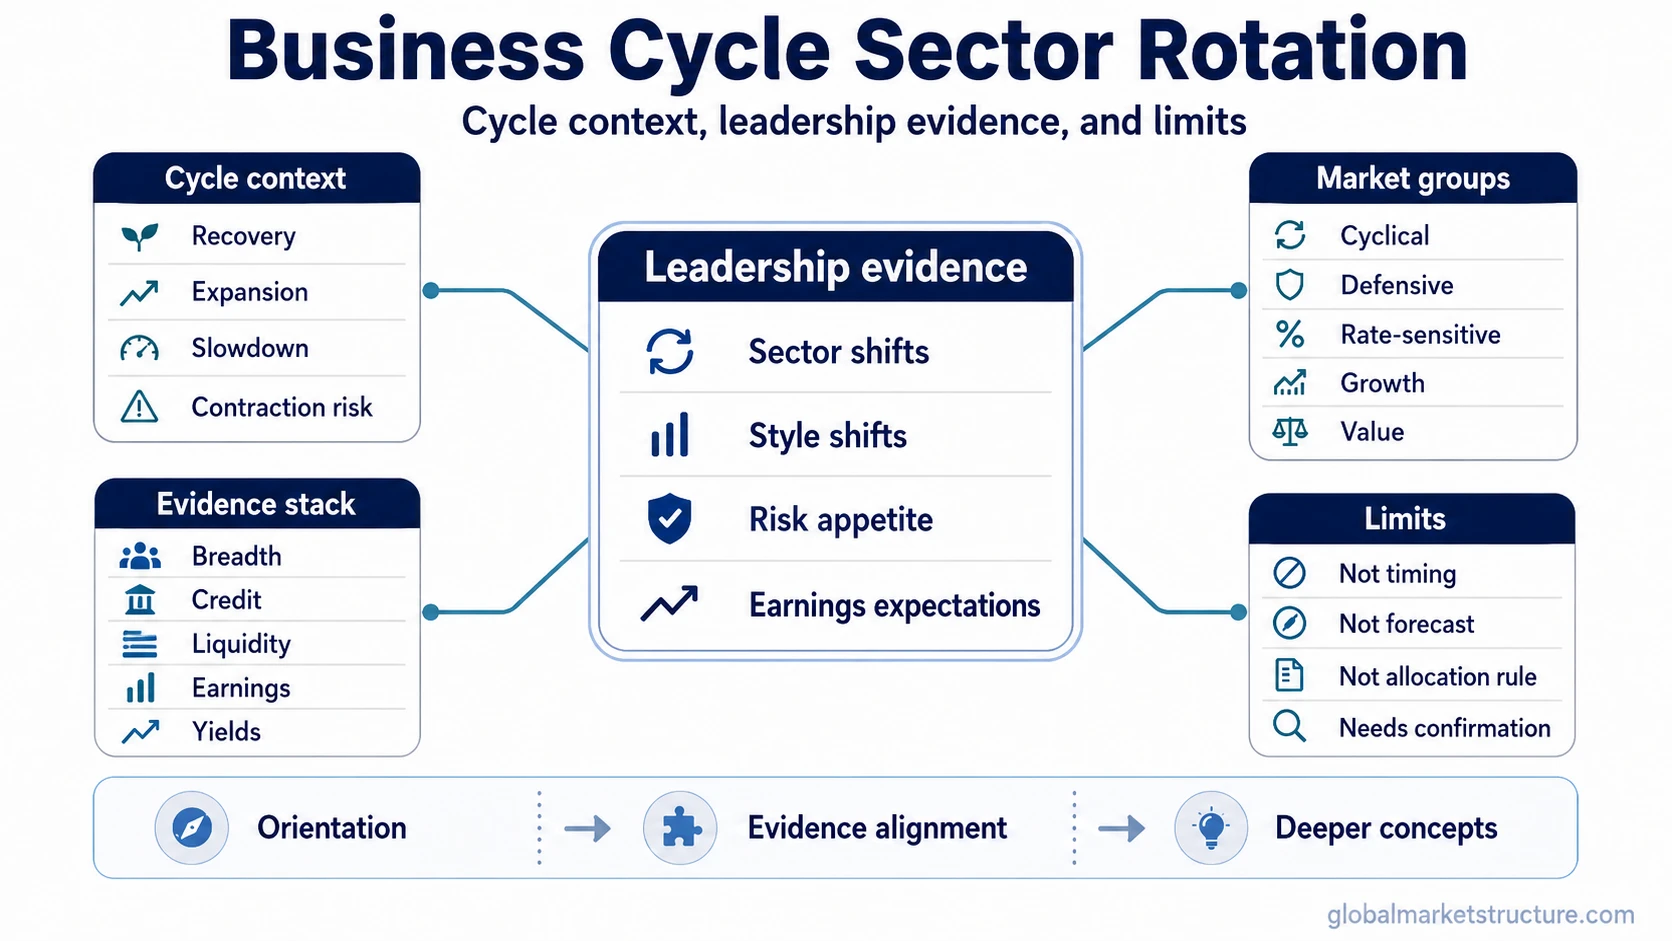
Business cycle sector rotation describes how sector and style leadership can shift as economic conditions move through recovery, expansion, slowdown, contraction, and recession risk. It connects growth, rates, inflation, liquidity, earnings expectations, and risk appetite, but it is not a timing signal, forecast, buy/sell rule, or allocation model.
Key Points
- Business cycle sector rotation is a classification framework for understanding leadership changes across market environments.
- Sector leadership may reflect growth sensitivity, defensiveness, rate sensitivity, earnings expectations, or risk appetite.
- Style leadership, such as growth versus value, can shift for different reasons than sector leadership.
- Leadership evidence can organize market context, but it does not confirm the current cycle phase by itself.
What business cycle sector rotation means
Business cycle sector rotation is the relationship between economic-cycle conditions and changing leadership across sectors, styles, and sensitivity groups. Different parts of the equity market may respond differently when growth improves, inflation pressures change, interest rates move, liquidity conditions tighten or ease, and investors change how much risk they are willing to hold.
The framework is useful for classification, not prediction. A cycle map can help organize the environment, but it should not be treated as a calendar. Market leadership can shift before economic data fully confirms a phase, after the phase is already visible, or for reasons that are not purely business-cycle related.
The broader concept of sector rotation explains leadership changes across sectors. Business cycle sector rotation is narrower because it interprets those leadership changes in relation to business-cycle conditions.
How cycle conditions can affect leadership
Business-cycle context matters because sectors do not all react to the same macro conditions in the same way. Some groups are more sensitive to improving growth, some are more defensive when growth expectations weaken, and some respond strongly to interest rates, credit conditions, or inflation expectations.
| Cycle context | Common leadership question | Safe interpretation |
|---|---|---|
| Recovery | Are growth-sensitive areas beginning to lead? | Early leadership can suggest improving risk appetite, but it does not prove that the economy has entered a durable recovery. |
| Expansion | Is leadership broadening or concentrating? | Broad participation can support a healthier market structure, while narrow leadership needs additional confirmation. |
| Slowdown or late cycle | Are defensive or quality-oriented areas gaining relative strength? | Defensive leadership may reflect caution, lower growth expectations, rate sensitivity, or positioning. It does not automatically confirm recession. |
| Contraction or recession risk | Is risk appetite weakening across several leadership measures? | Sector behavior is more useful when it aligns with breadth, credit, liquidity, earnings revisions, and macro data. |
The useful interpretation comes from the combination of signals, not from one sector move. A shift toward defensiveness, for example, means something different when credit spreads are calm than when credit stress, weak breadth, and falling earnings expectations appear at the same time.
The main branches to separate
A common mistake is treating business cycle sector rotation as one simple phase map. In practice, it combines several related ideas that need separate interpretation: business-cycle phase, sector sensitivity, style leadership, market leadership, and strategy application.
Sector sensitivity: Cyclical sectors are generally more sensitive to changes in economic activity, demand expectations, and risk appetite. Defensive sectors are usually less dependent on strong economic growth. Rate-sensitive sectors add another layer because they can react strongly to bond yields and financing conditions.
Style leadership: Sector rotation and style rotation are related, but they are not the same. Growth and value leadership can be shaped by rates, liquidity, valuation, earnings expectations, and sector composition. A style shift can therefore support, complicate, or contradict a simple sector-cycle reading.
Market leadership evidence: Market leadership asks which parts of the market are actually leading, how broad that leadership is, whether leadership is concentrated, and whether relative strength confirms or contradicts the cycle narrative.
Leadership is more useful when it is consistent across several measures. A sector can outperform for a short period without changing the larger market regime. A stronger reading usually requires breadth, relative strength, earnings context, liquidity conditions, and cross-market confirmation.
Where each question belongs
Business cycle sector rotation becomes clearer when each question is matched with the correct concept. The distinction matters because a phase label, sector label, style label, and strategy framework do not answer the same question.
| Question | Concept branch | Deeper concept | Why it matters | Boundary or limitation |
|---|---|---|---|---|
| What is the broad idea behind sectors changing leadership? | Core sector rotation | Sector rotation | Defines the main concept before tying it to the business cycle. | Does not identify the current cycle phase by itself. |
| Which groups are more sensitive to economic growth? | Sector sensitivity | Cyclical sectors | Explains why some sectors may respond more to growth expectations. | Cyclical leadership can reflect risk appetite, not confirmed recovery. |
| Which groups are less dependent on strong growth? | Defensive classification | Defensive sectors | Clarifies why some sectors may hold up during weaker growth expectations. | Defensive leadership does not prove recession or contraction. |
| Which areas are most sensitive to yields and financing conditions? | Rate sensitivity | Rate-sensitive sectors | Separates rate sensitivity from a simple cyclical-versus-defensive split. | Yield moves can reflect growth, inflation, policy expectations, or risk aversion. |
| Is leadership moving between growth, value, or other factor groups? | Style leadership | Style rotation | Separates sector behavior from factor and valuation behavior. | Style shifts can be driven by rates, liquidity, valuation, or earnings expectations. |
| Is leadership broad, narrow, durable, or fragile? | Leadership evidence | Market leadership | Tests whether the leadership pattern is supported by participation and confirmation. | Narrow leadership can persist and still leave the market more fragile. |
| How can sector leadership fit into a broader interpretation process? | Framework application | Sector rotation strategy | Connects rotation evidence with a broader market-structure framework. | A strategy framework still needs risk controls, confirmation, and uncertainty handling. |
Why phase maps can mislead
Many sector-rotation models show a neat sequence from recovery to expansion, slowdown, and contraction. That sequence can be useful as a learning tool, but real markets rarely follow it cleanly. Leadership can rotate because of earnings revisions, rate shocks, commodity moves, positioning, liquidity stress, or valuation resets rather than a simple business-cycle transition.
Key limitation: Business cycle sector rotation is weakest when it is used as a single-variable timing tool. A sector leading in a textbook phase does not prove that the phase is happening now, and a sector lagging in a textbook phase does not invalidate the broader cycle by itself.
The safer use is comparative. Sector behavior can be compared with breadth, credit spreads, yields, earnings revisions, liquidity conditions, and cross-asset confirmation. When those measures point in the same direction, the interpretation becomes stronger. When they conflict, the sector map should remain provisional.
Example of a safer interpretation
A market can show defensive sector leadership while major equity indexes remain near highs. That does not automatically mean a recession has started. The defensive move could reflect falling yields, investor preference for stable earnings, stretched valuations in prior leaders, or short-term positioning.
The interpretation becomes more serious if defensive leadership appears alongside weakening breadth, wider credit spreads, lower earnings revisions, tighter liquidity, and weaker cyclical participation. In that case, the sector pattern is not acting alone. It becomes one part of a broader risk-environment reading.
The same logic applies in the opposite direction. Cyclical leadership can be encouraging when it appears with improving breadth, better earnings expectations, easing financial conditions, and stronger risk appetite. Without those supporting signals, it may be only a short-term rotation rather than a durable cycle shift.
What business cycle sector rotation is not
Business cycle sector rotation is not a list of sectors to own in each phase. It is not a forecast of which sector will outperform next. It is not a current-cycle call, and it is not a substitute for valuation, risk management, macro evidence, or portfolio construction.
| Misuse | Why it is risky | Safer interpretation |
|---|---|---|
| Using a phase map as a calendar | Economic and market cycles do not move on a fixed schedule. | Use phase labels as context, not timing rules. |
| Treating one leading sector as proof | Single-sector outperformance can reflect positioning, rates, earnings, or valuation. | Look for confirmation across breadth, credit, liquidity, earnings, and cross-asset behavior. |
| Assuming textbook sectors always lead | Each cycle has different inflation, policy, valuation, and liquidity conditions. | Compare the current leadership mix with the broader environment before assigning meaning. |
| Turning leadership into a buy/sell rule | Leadership classification does not define risk, position sizing, or expected return. | Keep rotation analysis separate from allocation decisions and trade execution. |
Business cycle sector rotation vs nearby concepts
Business cycle sector rotation overlaps with several related ideas, but each concept has a different job. Keeping them separate prevents the framework from becoming too broad or too deterministic.
| Concept | Main question | How it differs |
|---|---|---|
| Sector rotation | Which sectors are leading or lagging? | Broader than the business-cycle lens because sector leadership can shift for many reasons. |
| Cyclical vs defensive sectors | How sensitive is a sector to growth conditions? | A classification lens, not a complete cycle interpretation. |
| Style rotation | Are growth, value, quality, momentum, or size factors changing leadership? | Can overlap with sector rotation but also reflects valuation, rates, liquidity, and factor exposure. |
| Market leadership | Is leadership broad, narrow, improving, or deteriorating? | Focuses on evidence quality rather than assigning a fixed sector to a fixed cycle phase. |
| Sector rotation strategy | How can rotation evidence fit into a repeatable interpretation process? | Uses sector behavior as one input rather than treating the cycle map as a standalone signal. |
FAQ
What is business cycle sector rotation?
Business cycle sector rotation is the idea that sector and style leadership can shift as economic conditions move through recovery, expansion, slowdown, contraction, and recession risk. It is a market-context framework, not a timing signal.
Does business cycle sector rotation predict which sector will lead next?
No. It can help classify leadership patterns, but it does not predict the next leading sector or provide a buy/sell rule.
Why can sector rotation fail as a cycle signal?
Sector leadership can change because of rates, liquidity, valuation, earnings revisions, commodity exposure, or positioning. A single sector move is not enough to confirm a business-cycle phase.
How is business cycle sector rotation different from sector rotation?
Sector rotation describes leadership shifts across sectors in general. Business cycle sector rotation focuses on how those shifts relate to business-cycle conditions.
What makes a sector-rotation reading stronger?
A reading is stronger when sector leadership aligns with market breadth, credit conditions, liquidity, earnings expectations, yields, and cross-asset confirmation.