
Cross asset correlation measures how different asset classes move in relation to each other over a selected period. It can compare equities, bonds, commodities, currencies, credit, volatility, or other market groups. The relationship is historical and window-dependent, so it can support market-structure interpretation without proving causation, predicting the next move, or creating a standalone signal.
Definition: Cross asset correlation is the measured relationship between price or return changes in different asset classes. A positive correlation means the assets have tended to move in the same direction over the selected window. A negative correlation means they have tended to move in opposite directions. A near-zero reading means the relationship has been weak, mixed, or inconsistent during that window.
What Is Cross Asset Correlation?
Cross asset correlation compares movement across market categories rather than movement inside one market alone. Instead of asking whether two stocks move together, it asks whether different asset classes, such as equities and bonds, the dollar and commodities, or credit and equity indices, are showing similar or opposite behavior.
The cross-asset distinction matters because broader market groups often respond to shared conditions. Rates, liquidity, inflation expectations, credit stress, dollar pressure, and risk appetite can affect several markets at once. Correlation organizes that co-movement, but it does not identify the full cause by itself.
How the Correlation Reading Works
A correlation reading is usually expressed between -1 and +1. A reading near +1 means two assets have moved closely together during the measured period. A reading near -1 means they have moved in opposite directions. A reading near 0 means the relationship has been weak, mixed, or unstable.
The selected window matters. A short window can react quickly but may be noisy. A longer window can smooth noise but may hide recent regime change. A rolling correlation updates the measurement through time, which can reveal whether the relationship is strengthening, weakening, or breaking down.
| Reading | Basic meaning | Interpretation limit |
|---|---|---|
| Positive correlation | The assets have tended to move in the same direction. | It does not prove that one asset caused the other to move. |
| Negative correlation | The assets have tended to move in opposite directions. | It does not guarantee protection during stress or regime shifts. |
| Near-zero correlation | The measured relationship has been weak or inconsistent. | It may reflect noise, changing drivers, or an unsuitable measurement window. |
What Cross Asset Correlation Can Show
Cross asset correlation can help identify whether different markets are responding to a shared condition. The main question is not only whether two assets moved together, but which driver may explain the relationship and whether surrounding evidence supports that interpretation.
| Relationship observed | What it can show | Main limitation |
|---|---|---|
| Equities and high-yield credit moving together | Risk appetite may be affecting both equity and credit pricing. | The relationship can weaken if credit starts pricing stress before equities respond. |
| Stocks and bonds moving together | A shared discount-rate or inflation-pressure channel may be influencing both markets. | The same relationship can mean different things in growth-led, inflation-led, or policy-led environments. |
| DXY and commodities moving in opposite directions | Dollar pressure may be part of the commodity-market backdrop. | Supply, demand, geopolitics, and positioning can override a simple currency reading. |
| Rates and growth-sensitive assets moving together | The market may be treating higher yields as growth confirmation rather than stress. | The interpretation can change if higher yields begin reflecting inflation pressure or policy tightening. |
Why Correlations Change Across Regimes
Cross asset correlations are not fixed. They can change when the dominant market driver changes. A relationship that looked stable during one environment can weaken or reverse when inflation, liquidity, policy expectations, credit conditions, currency pressure, or growth expectations take control of the market narrative.
For example, bonds may behave differently when yields are falling because growth expectations are weakening than when yields are falling because inflation pressure is easing. Equities may also respond differently depending on whether the move improves liquidity conditions, lowers discount-rate pressure, or signals weaker earnings expectations.
Cross asset correlation is strongest when paired with context. Co-movement is the measurement. The broader interpretation depends on the regime driver, the asset classes involved, and whether other markets confirm or contradict the same message.
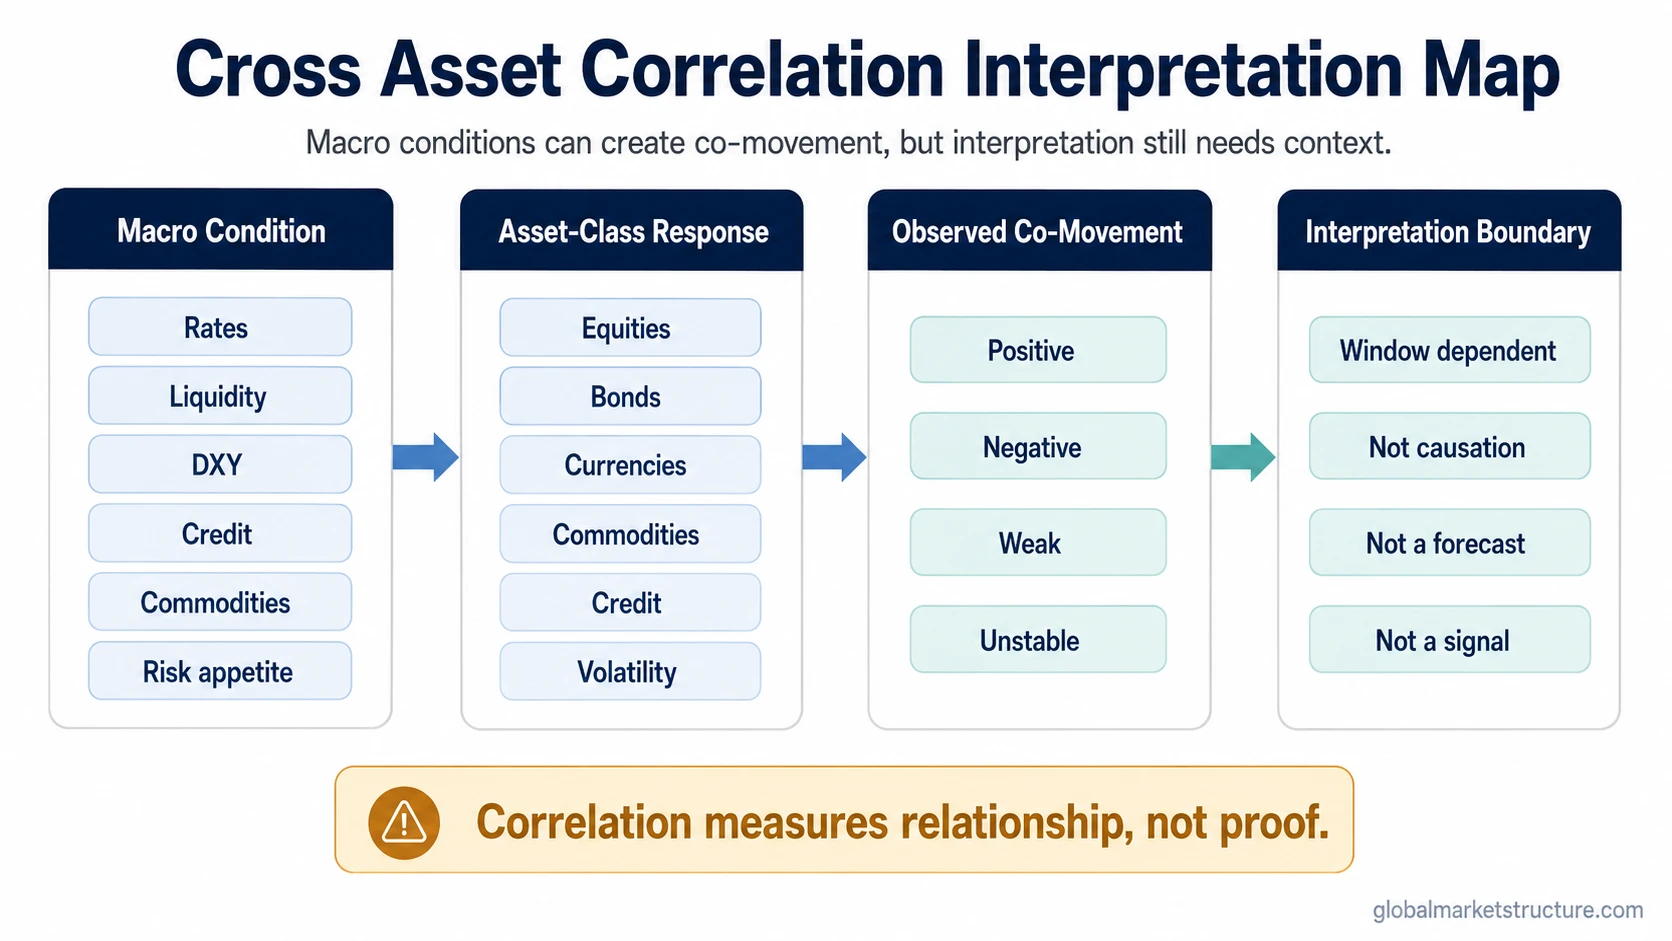
Mechanism map:
Macro condition: Rates, liquidity, inflation, growth, policy, credit, or currency pressure changes the market backdrop.
Asset-class response: Different markets react through their own sensitivity to that driver.
Observed co-movement: The relationship appears as positive, negative, weak, or unstable correlation.
Interpretation boundary: The reading remains incomplete until credit, currency, liquidity, breadth, volatility, or related evidence supports it.
Cross Asset Correlation in Intermarket Analysis
Cross asset correlation is one input inside broader intermarket analysis. It helps compare how different market groups are behaving, but it does not replace the wider process of checking rates, currencies, credit, commodities, liquidity, volatility, and risk appetite together.
The distinction is important. Cross asset correlation measures the relationship between asset moves. Intermarket analysis asks how those relationships fit into a larger market environment. A correlation reading can raise a useful question, but the broader framework determines whether the question has enough supporting evidence.
Common False Readings
Correlation is not causation: Two assets can move together because both respond to a third driver, such as rates, liquidity, inflation, or risk appetite.
The window can distort the result: A short lookback may exaggerate noise, while a long lookback may hide recent change.
Stress can change relationships: Relationships that usually reduce co-movement can become less reliable when liquidity pressure, forced de-risking, or broad risk reduction dominates.
A negative relationship is not guaranteed protection: Opposite movement in one period does not ensure the same behavior in another.
No standalone signal exists: Cross asset correlation can support interpretation, but it is not a buy signal, sell signal, forecast, or allocation rule.
When a previously stable relationship weakens, reverses, or becomes unreliable, the issue moves toward correlation breakdown. That boundary matters because a failed relationship can change the meaning of signals that looked clear under the previous regime.
Illustrative Scenario
Imagine an environment where inflation and rate pressure dominate the market backdrop. Equities may weaken because discount-rate pressure rises, while bonds may also weaken because yields move higher. The result can be a positive stock-bond correlation, even though many investors may expect stocks and bonds to move in opposite directions.
The diagnostic point is that the relationship needs a driver before it can be interpreted. In this scenario, the shared driver is rate pressure, and the interpretation remains incomplete without checking inflation expectations, policy expectations, credit behavior, liquidity conditions, and risk appetite.
How to Interpret the Reading
A cleaner interpretation separates four questions: what moved together, over what window, under which driver, and with what confirmation from other markets. The correlation measurement answers only the first two questions directly. Regime interpretation requires additional evidence.
| Question | Why it matters |
|---|---|
| Which assets are being compared? | Different asset pairs respond to different drivers, so the relationship must match the market question. |
| What window is being measured? | The same pair can show different relationships across short, medium, and long periods. |
| What driver may explain the co-movement? | Rates, liquidity, credit, DXY, commodities, and risk appetite can all change the meaning. |
| What would weaken the interpretation? | Contradictory signals, unstable windows, or changing regime drivers can make the relationship less useful. |
FAQ
Does cross asset correlation prove causation?
No. Correlation shows measured co-movement, not cause. Two markets may move together because both are responding to the same third driver, such as rates, liquidity, inflation expectations, credit conditions, or risk appetite.
Can cross asset correlation fail during regime shifts?
Yes. A relationship that looked stable in one environment can weaken, reverse, or become unreliable when the dominant driver changes. The selected window, market stress, liquidity conditions, and supporting evidence all affect the interpretation.