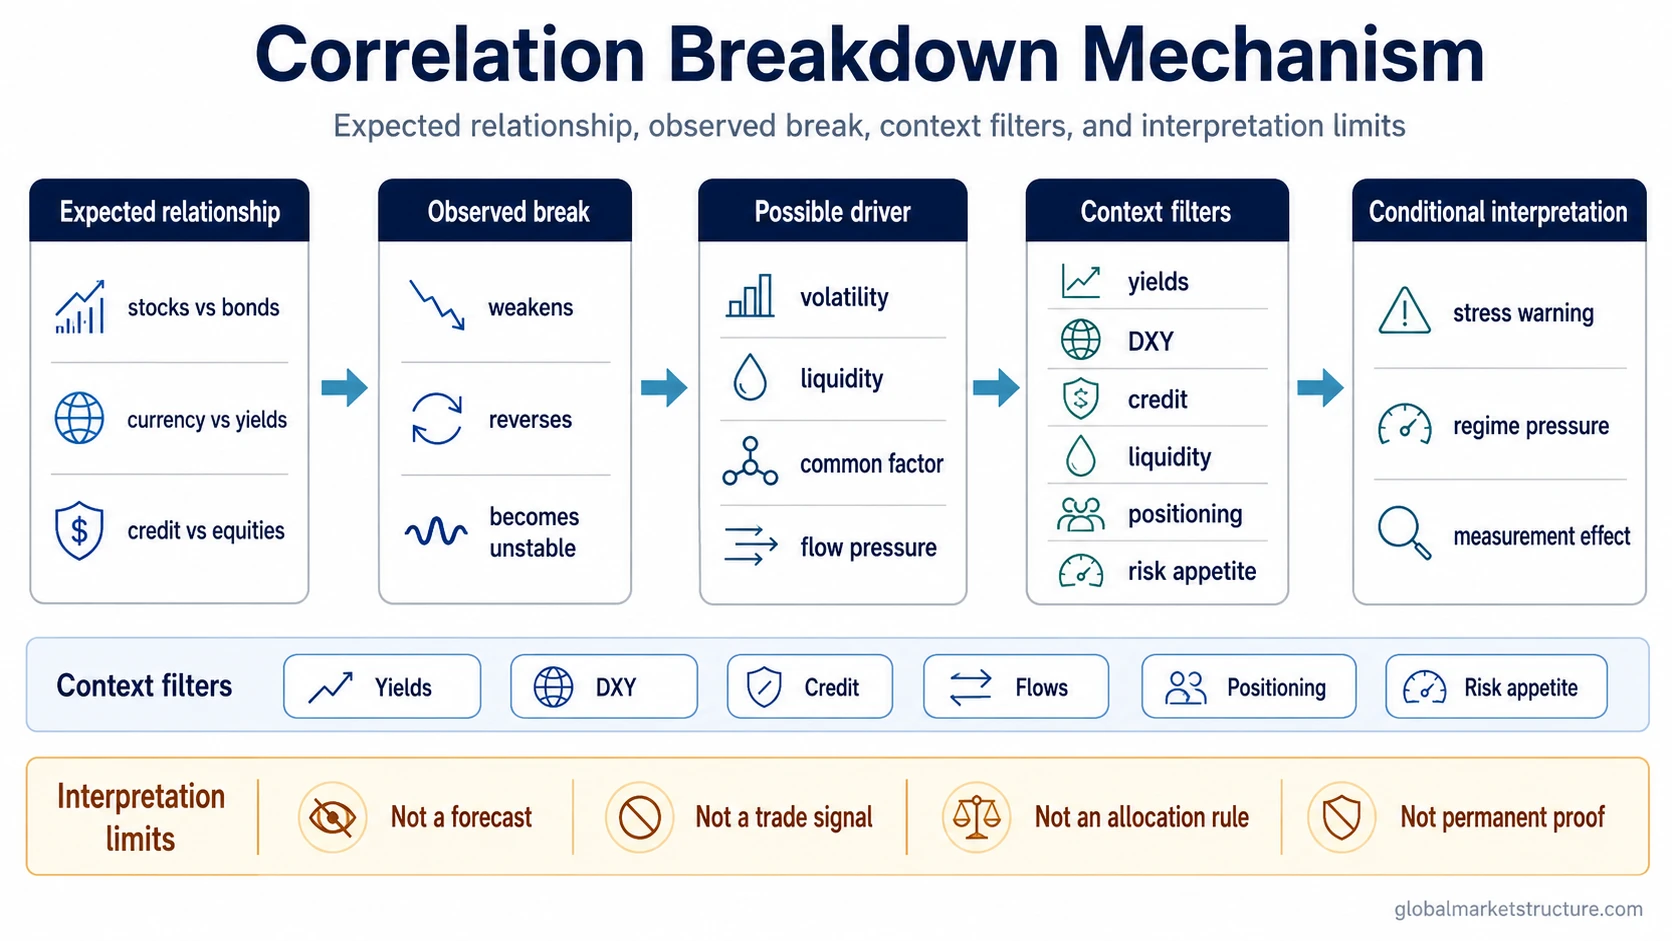
Correlation breakdown occurs when an expected relationship between assets, markets, or variables stops behaving normally. The relationship may weaken, reverse, become unstable, or fail under changed market conditions.
In markets, the break can reflect stress, regime pressure, common-factor exposure, flow pressure, positioning, or measurement distortion. It is not automatically a forecast, a trade signal, an allocation rule, contagion proof, or evidence that diversification has permanently failed.
What Correlation Breakdown Means
Correlation describes how two variables tend to move in relation to each other. Correlation breakdown describes a failure or sharp instability in an expected relationship.
A normal correlation change can happen gradually as conditions evolve. A correlation breakdown is more notable because the expected relationship stops giving the same interpretation under the current volatility, liquidity, policy, flow, or risk environment.
Key Points
- Correlation breakdown means an expected relationship stops behaving normally.
- The break can reflect stress, regime pressure, common-factor exposure, flow pressure, or measurement distortion.
- Short sampling windows and high volatility can exaggerate measured changes.
- The break does not automatically prove permanent diversification failure, contagion, or a macro forecast.
- The useful interpretation comes from context filters: liquidity, rates, credit, dollar pressure, flows, positioning, and risk appetite.
Why Correlations Can Break Down
Expected relationships can break when the force driving both assets changes. A pair that normally moves differently may begin moving together if both are being repriced by the same factor, such as tighter liquidity, rising volatility, credit stress, dollar pressure, or a sharp shift in policy expectations.
The first step is to separate the observation from the interpretation. The observation is the changed relationship. The interpretation depends on what else is happening across markets.
A breakdown becomes more meaningful when it appears alongside confirming context: weaker market depth, wider credit spreads, unstable funding conditions, sharp real-yield or nominal-yield moves, stronger dollar pressure, forced flows, crowded positioning, or a broader shift in risk appetite.
Correlation Breakdown Diagnostic Table
| Observed break | Possible interpretation | Context filter | Limitation or false reading |
|---|---|---|---|
| Assets that normally diversify each other move together | A common factor may be dominating both assets | Volatility, liquidity, rates, dollar pressure, credit spreads, flows | Does not prove permanent diversification failure |
| Correlation flips sign over a short window | Short-window stress or positioning may be affecting the data | Sampling window, volume, market depth, volatility regime | Does not prove a structural regime change |
| Cross-asset relationship weakens suddenly | Risk appetite, policy expectations, or funding pressure may have shifted | Real yields, nominal yields, DXY, credit spreads, liquidity conditions | Not a standalone forecast |
| Expected safe-haven behavior fails | Forced selling, hedging pressure, or flow constraints may be active | Funding markets, positioning, redemption pressure, volatility | Not automatically contagion proof |
The Common Mistake: Treating the Break as a Signal
The main error is treating one observed break as if it already explains the market. A short-window correlation shift can look dramatic, but the shift may come from volatility, sampling effects, temporary flows, model design, or crowded positioning rather than a durable change in the relationship.
A correlation breakdown becomes more useful when it is treated as a diagnostic warning. It raises a question: what changed in the broader market structure? It does not answer that question by itself.
A Practical Scenario
A common scenario is that equities, bonds, and a major currency relationship stop matching a familiar stress template. Stocks may fall, bonds may fail to cushion the move, and the currency response may point to funding pressure rather than ordinary risk-off behavior.
The observed break is not enough to call a structural regime shift. The stronger check is whether volatility is rising, liquidity is weakening, credit spreads are widening, real or nominal yields are moving in a way that pressures both assets, dollar demand is increasing, and positioning is forcing similar behavior across otherwise different markets.
If those filters align, the breakdown may point to a broader market-structure problem. If they do not align, the break may be a short-window measurement issue or a temporary flow event.
How Correlation Breakdown Fits Within Intermarket Analysis
Cross-asset correlation is the broader relationship layer. Correlation breakdown is one failure condition inside that layer, where the expected relationship becomes unstable or stops carrying the same meaning.
Intermarket analysis adds the surrounding context. A correlation break is stronger when other markets confirm the same pressure through liquidity, credit, yields, the dollar, flows, positioning, or risk appetite.
Interpretation Limits
Measured correlation is sensitive to the chosen window, data frequency, volatility regime, and market conditions. A short window can make a relationship look broken even when the longer-term relationship has not changed in a durable way.
Correlation breakdown is best handled as a conditional warning, not a conclusion. The break identifies stress in an expected relationship. The explanation still has to come from the surrounding macro, liquidity, credit, flow, and positioning evidence.
FAQ
Is correlation breakdown a trade signal?
No. A correlation breakdown can warn that an expected relationship is unstable, but it does not create a buy or sell signal by itself. The interpretation depends on liquidity, volatility, rates, credit, dollar pressure, flows, positioning, and risk appetite.
Does correlation breakdown mean diversification failed?
Not automatically. Diversification can weaken temporarily when a common factor affects multiple assets at the same time. That does not prove that diversification has permanently failed or that the relationship has structurally changed.
How is correlation breakdown different from normal correlation change?
Normal correlation change can occur as market conditions evolve. Correlation breakdown is a sharper failure or instability in an expected relationship, especially when the change appears during stress, volatility, liquidity pressure, or regime transition.