Market Breadth

Market breadth is the degree to which stocks or index constituents participate in a market move. It shows whether headline index strength or weakness is broadly supported or driven by a narrower group. Breadth can be observed through advancing versus declining stocks, the A/D Line, new highs and lows, or stocks above moving averages. It adds context, but it does not forecast the next move by itself.

Market breadth in one paragraph: Market breadth looks beneath the index headline and asks how many securities are moving with the broader market. Broad breadth means participation is distributed across many stocks or sectors. Narrow breadth means the headline move depends on fewer contributors. The concept is useful because it separates index direction from participation quality, but it should be read as context rather than as a timing rule.

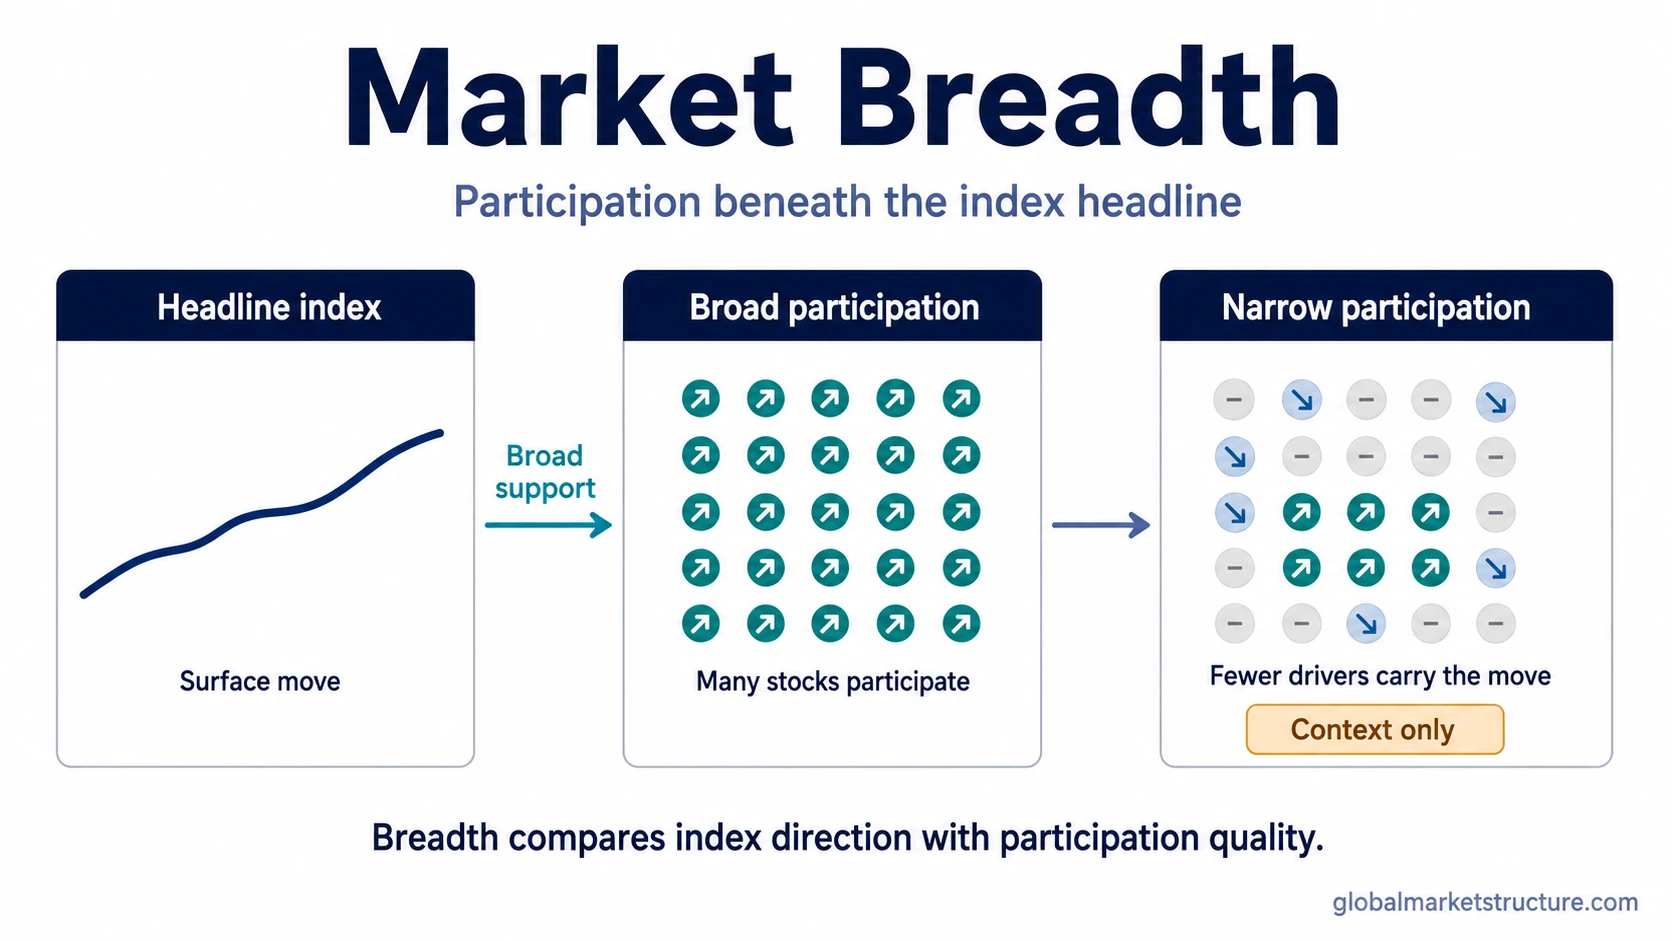
Market breadth infographic comparing a headline index move with broad and narrow stock participation beneath it.
Market breadth compares the index headline with the participation quality beneath it.

How Market Breadth Works

Market breadth compares the visible index move with the participation beneath it. A broad index can rise even when only a smaller group of constituents is doing most of the work. It can also fall while many stocks are already stabilizing underneath the headline. Breadth helps identify whether the index move is widely confirmed or more narrowly carried.

The central idea is simple: an index level is an aggregate result, while breadth describes the distribution of participation inside that result. Two market days can produce similar index moves but very different internal structures if one move is supported by many stocks and the other is concentrated in only a few large components.

Step What is observed What it can suggest Main limitation
Headline index move The index rises, falls, or trades sideways. The market headline gives the surface direction. The index alone does not show how many stocks participated.
Constituent participation More stocks advance, decline, reach highs, reach lows, or hold above moving averages. Participation may be broad, narrow, improving, or deteriorating. Different breadth measures can disagree.
Breadth condition Participation confirms or fails to confirm the headline move. Broad participation can make an index move look better supported. Narrow participation can expose dependency on fewer drivers. Breadth does not prove continuation or reversal.
Interpretation Breadth is read alongside liquidity, credit, volatility, sector participation, index construction, and concentration. It can improve risk-environment context. It is only one layer of market-structure interpretation.

Broad Breadth Versus Narrow Breadth

Broad breadth means many stocks or groups are participating in the same general direction as the headline index. In a rising market, that can mean the advance is not limited to a small group of large constituents. In a falling market, broad negative breadth can show that weakness is spreading across the market rather than remaining isolated.

Narrow breadth means participation is limited. A headline index may still look strong, but the internal participation may be weaker if fewer stocks are advancing or if strength is concentrated in a small set of influential components. That does not automatically make the index move false, but it does change the quality of the evidence behind the move.

Illustrative scenario: A headline index can rise while many smaller constituents are flat or declining. In that situation, market breadth may show weaker participation than the index headline suggests. The interpretation is not automatically bearish, but it warns that index strength is being carried less broadly.

Common Forms of Market Breadth

Market breadth is not one single indicator. It is an umbrella concept that can be observed through several measurement families. The specific tool matters less than the question behind it: is participation broadening, narrowing, confirming, or failing to confirm the headline index move?

Breadth form What it observes How to interpret it safely
Advancing versus declining stocks How many stocks are rising compared with how many are falling. Useful for judging whether participation is broad or narrow during a market move.
A/D Line The cumulative relationship between advancing and declining issues. Useful as one breadth view, but not the full concept of market breadth.
Stocks above moving averages How many stocks remain above selected trend reference points. Useful for participation quality, but sensitive to the chosen moving average and universe.
New highs and new lows How many stocks are reaching fresh highs or fresh lows. Useful for leadership and weakness distribution, but not enough to time a move on its own.
Breadth thrust behavior Rapid improvement in participation after weakness or narrow breadth. Best treated as a related but narrower concept, not as the same thing as market breadth.

A breadth thrust indicator focuses on rapid participation repair. Market breadth is broader: it describes participation quality in general, whether that participation is expanding, weakening, mixed, or stable.

What Market Breadth Can And Cannot Tell You

Market breadth can help judge the quality of an index move. If the index is rising and many constituents are also advancing, participation is more broadly distributed. If the index is rising while fewer constituents participate, the move may be more dependent on a narrower leadership group.

Breadth can also help interpret weakness. A falling index with broad negative participation can show that pressure is spreading. A falling index with improving participation underneath may suggest that internal conditions are no longer deteriorating at the same pace. These are interpretation clues, not complete conclusions.

What breadth does not prove: Market breadth does not prove that a trend will continue, that a reversal is near, that a top or bottom has formed, or that a specific trade should be taken. It does not replace liquidity, credit, volatility, sector behavior, index construction, or concentration analysis.

In market-structure analysis, the useful role of breadth is risk-environment context. It can strengthen or weaken the interpretation of index movement, but it should remain one layer in a broader market-structure reading.

Market Breadth Versus Market Concentration

Market breadth and market concentration are related, but they are not the same concept. Breadth asks how widely stocks are participating. Concentration asks how dependent an index or market move is on a smaller set of large drivers.

A market can have narrow breadth because fewer stocks are advancing. A market can also have high concentration because a small number of large constituents account for a large share of index weight or index performance. The two conditions can appear together, but they describe different parts of the internal market structure.

Concept Main question Not the same as
Market breadth How widely are stocks participating in the move? A live indicator dashboard or a trading signal.
Market concentration How dependent is the index on a smaller set of dominant drivers? The full participation picture across all constituents.
Breadth divergence Is index direction failing to match participation behavior? The entire market breadth concept.
Breadth thrust Is participation improving rapidly after prior weakness? All forms of breadth analysis.
Market breadth indicators Which tools measure participation? The broader interpretation of participation quality.

Why Market Breadth Can Mislead

Market breadth can mislead when it is treated as a single number instead of a participation context. One breadth measure may look constructive while another looks weaker because each measure uses a different market universe, time frame, or calculation method.

Index construction also matters. A capitalization-weighted index can look strong when a few large constituents rise, even if many smaller constituents are not confirming the move. Equal-weighted participation, sector participation, and new-high/new-low behavior may give a different picture from the headline index.

Sector mix can also distort the reading. A market can show weak breadth because weakness is concentrated in one large sector, or it can show apparently broad strength while defensive participation dominates. The breadth reading becomes more useful when it is interpreted with sector behavior, liquidity conditions, volatility, credit, and concentration risk.

Current readings require current data. Conceptual breadth analysis explains what live breadth values can and cannot mean; it should not be confused with the data endpoint that reports the latest values. A dashboard can show the latest breadth values, while the underlying concept explains how those values can be interpreted and limited.

Where Market Breadth Fits In Market Structure

Market breadth belongs inside index-internal and participation analysis. It helps translate a headline market move into a clearer view of how much of the market is actually involved. That makes it especially relevant when headline strength looks impressive but participation appears narrow, or when headline weakness remains visible while participation is no longer deteriorating as broadly.

The strongest use of breadth is comparative. It can compare an index move with constituent participation, one sector with another, or one phase of participation with another. It becomes weaker when it is forced into a standalone conclusion without checking the surrounding market environment.

A disciplined reading separates the concept from the tools. Market breadth is the participation question. Breadth indicators are measurement methods. Breadth divergence is one type of non-confirmation. Breadth thrust is one type of rapid improvement. Market concentration is a separate question about dependence on dominant drivers.

FAQ

What is market breadth?

Market breadth is the degree to which stocks or index constituents participate in a market move. It helps show whether headline index movement is broadly supported or driven by a narrower group.

Is market breadth a trading signal?

No. Market breadth can add context about participation quality, but it does not act as a standalone buy signal, sell signal, forecast, or complete trading system.

What are common market breadth measures?

Common breadth measures include advancing versus declining stocks, the A/D Line, stocks above moving averages, and new highs versus new lows. Each measure captures a different view of participation.

What does narrow market breadth mean?

Narrow market breadth means fewer stocks are participating in the headline move. It can show that index strength or weakness is less broadly distributed, but it does not prove what the market will do next.

How is market breadth different from market concentration?

Market breadth asks how widely stocks are participating. Market concentration asks how dependent an index or market move is on a smaller group of dominant drivers. The two can overlap, but they measure different internal conditions.