Breadth Divergence

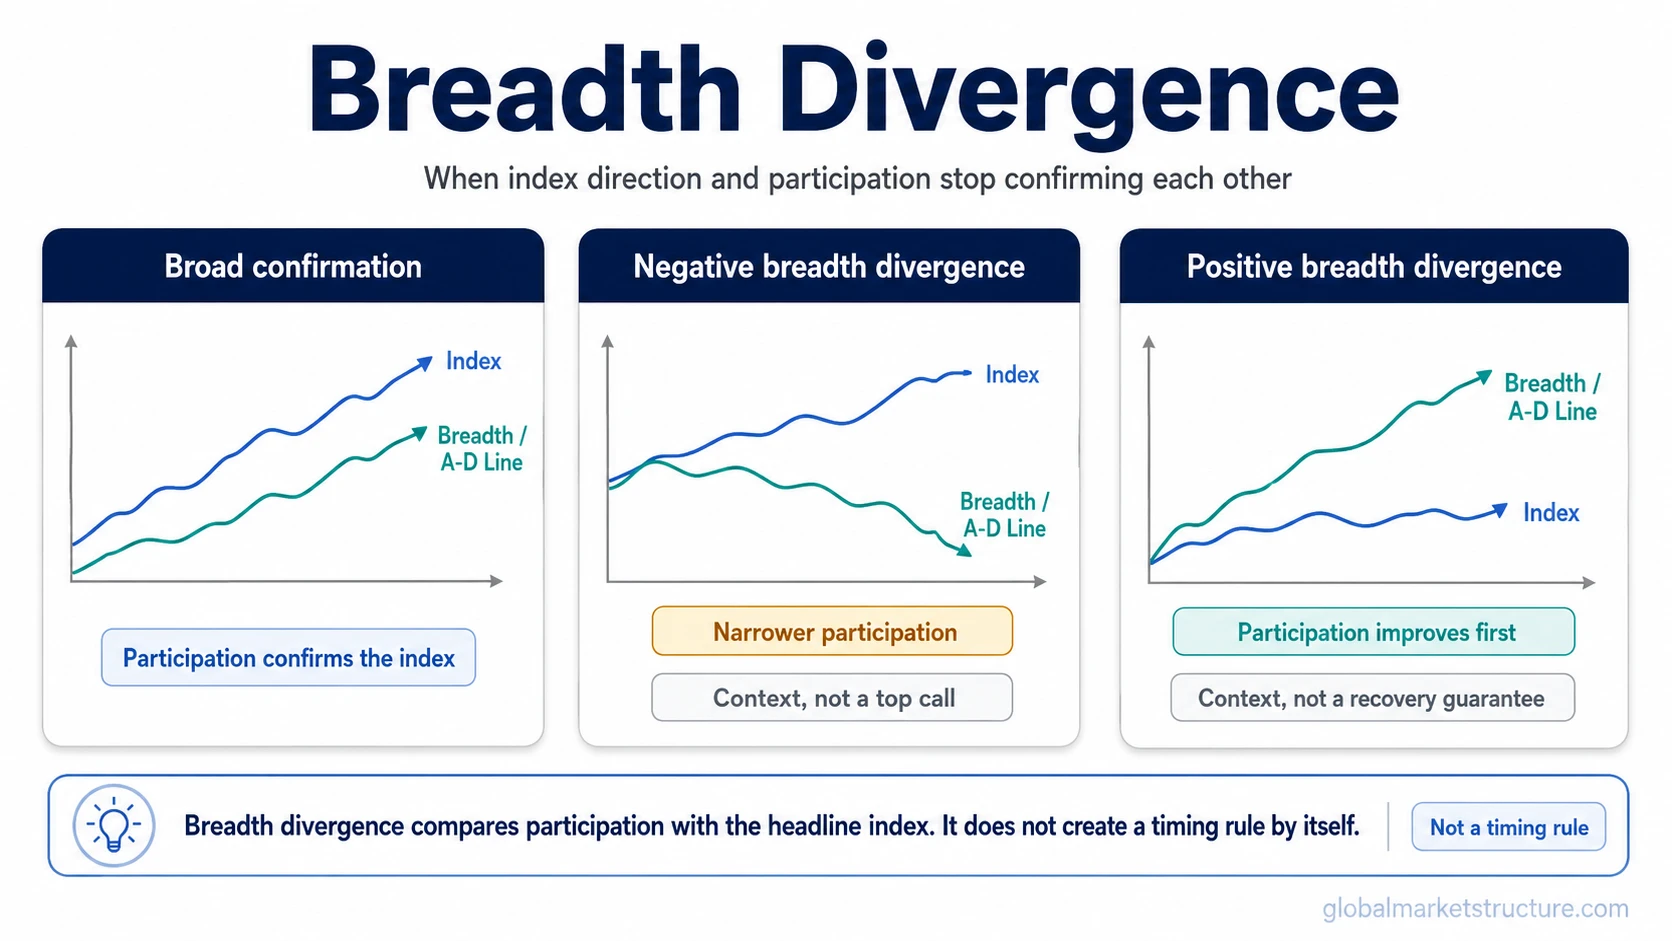
Breadth divergence is a market-breadth condition where a headline index and underlying participation stop confirming each other. It often appears when an index rises while fewer components participate, or when breadth improves before the index clearly recovers. The condition can help interpret participation quality, but it does not by itself predict timing, a market top, or a trading signal.

Definition: Breadth divergence means the direction of a market index and the behavior of underlying market breadth are moving out of alignment. The divergence is about participation confirmation, not a standalone forecast.

How breadth divergence appears

Breadth divergence compares the visible index move with what is happening beneath the index. A headline index may rise because a smaller group of large components is carrying the move, while a broader set of stocks is flat, weakening, or failing to participate. The reverse can also happen when breadth improves before the headline index has clearly turned higher.

A common way to observe this is through a breadth measure such as the Advance-Decline Line. If the index continues higher while the A/D Line fails to confirm the move, the market may be showing weaker participation beneath the surface. The A/D Line is only one example, not the whole definition of breadth divergence.

Type What it shows Interpretation boundary
Negative breadth divergence The index rises or holds up while participation weakens. It can show narrowing participation, but it does not prove a market top.
Positive breadth divergence Breadth improves while the index remains weak, flat, or slower to recover. It can show improving participation, but it does not prove a durable recovery.
Breadth divergence mismatch between a headline index and market breadth participation.
Breadth divergence compares headline index behavior with underlying participation. It adds market breadth context, but it is not a standalone timing rule or trading signal.

Why breadth divergence matters

The value of breadth divergence is that it separates index price from participation quality. A market can look strong at the index level while fewer components are doing the work. That distinction matters because broad participation and narrow participation describe different internal market conditions.

When index strength becomes dependent on fewer large components, the pattern can overlap with market concentration. Concentration explains the structure of top-heavy index performance. Breadth divergence explains the non-confirmation between the headline index and underlying participation.

The same logic applies in the opposite direction. If more components begin improving while the index remains weak, breadth may be recovering before the headline index reflects it clearly. That can make the internal picture more constructive, but it still remains an interpretation layer rather than a timing rule.

What strengthens or weakens the reading

Breadth divergence becomes more useful when it is persistent, visible across more than one breadth measure, and consistent with the broader risk environment. It becomes weaker when it depends on one isolated indicator, appears briefly, or is only obvious after the fact.

Condition Strengthens the interpretation Weakens the interpretation
Duration The divergence persists across several sessions or observations. The divergence appears briefly and then disappears.
Indicator agreement Several breadth measures point to the same participation issue. Only one measure diverges while others confirm the index.
Index structure Index performance is increasingly carried by fewer components. Leadership remains broad even if one breadth line looks uneven.
Risk context Other risk measures also show deteriorating participation or risk appetite. Broader risk context remains stable or contradicts the divergence.
Reading quality The mismatch is visible in real time and tied to a clear participation measure. The divergence is identified only after the outcome is already known.

These conditions are not a trading checklist. They separate a cleaner participation warning from a weaker or more ambiguous observation.

Common misread: divergence is not a timing signal

Limitation: Breadth divergence does not prove that a reversal, correction, crash, rally, or recovery is about to happen. Divergences can persist, disappear, or be overwhelmed by other market forces. The useful question is whether participation confirms the index move, not whether the divergence alone gives a trade decision.

A negative divergence can appear before market weakness, but it can also persist while the index keeps rising. A positive divergence can appear before broader improvement, but it can also fail if the internal improvement does not spread or if risk conditions deteriorate again.

The practical mistake is treating breadth divergence as a prediction instead of a context signal. It is more defensible to read it as evidence about participation quality, then compare it with other breadth, concentration, liquidity, and risk-environment information.

How this can appear in practice

A large-cap index pushes higher while fewer stocks advance and a breadth measure fails to confirm the move. That does not prove a reversal. It can show that index strength is becoming narrower and more dependent on a smaller group of components. The interpretation becomes stronger if the same pattern persists and appears across more than one breadth measure.

The same idea can work in reverse. If the headline index remains weak while more components begin to advance, breadth may be improving before price-level confirmation is obvious. That can make the internal market structure less weak than the index alone suggests, but it still does not prove timing or outcome.

Breadth divergence versus related concepts

Breadth divergence sits inside market breadth, but the two are not the same. Market breadth is the broader concept of participation across components. Breadth divergence is the narrower condition where that participation stops confirming the headline index.

Concept Main role How it differs from breadth divergence
Market breadth Measures how broadly components participate. It is the broader category. Breadth divergence is one non-confirmation condition inside it.
Market concentration Shows how dependent index performance is on a smaller group of large components. It explains top-heavy structure. Breadth divergence explains index-versus-participation mismatch.
Advance-Decline Line Tracks advancing versus declining components over time. It is one breadth measure that may show divergence, not the definition of divergence itself.
Market breadth indicators Set of measures used to evaluate participation. They provide measurement inputs. Breadth divergence describes the mismatch those inputs can reveal.

For a broader toolset, the next layer is market breadth indicators. The narrower focus is the mismatch between breadth and the index, rather than the full breadth-indicator toolkit.

FAQ

What is breadth divergence?

Breadth divergence is a mismatch between a headline index and underlying participation. It appears when the index and breadth measures stop confirming each other.

What is negative breadth divergence?

Negative breadth divergence occurs when an index rises or holds up while fewer components participate. It can show narrowing participation, but it does not prove that a market top or reversal is near.

What is positive breadth divergence?

Positive breadth divergence occurs when breadth improves while the index remains weak or slower to recover. It can show improving participation beneath the surface, but it does not confirm a durable recovery by itself.

Is breadth divergence a trading signal?

No. Breadth divergence is context about participation quality. It should not be treated as a standalone buy signal, sell signal, market-top call, or timing rule.

Which indicator is used for breadth divergence?

Several breadth measures can be used. The Advance-Decline Line is a common example, but breadth divergence is the mismatch between index behavior and participation, not one specific indicator.