
Market breadth indicators are market-wide participation measures used to compare headline index movement with the stocks, sectors, or volume flows participating beneath it. They are a toolkit rather than one indicator, and different measures can describe different parts of the participation picture.
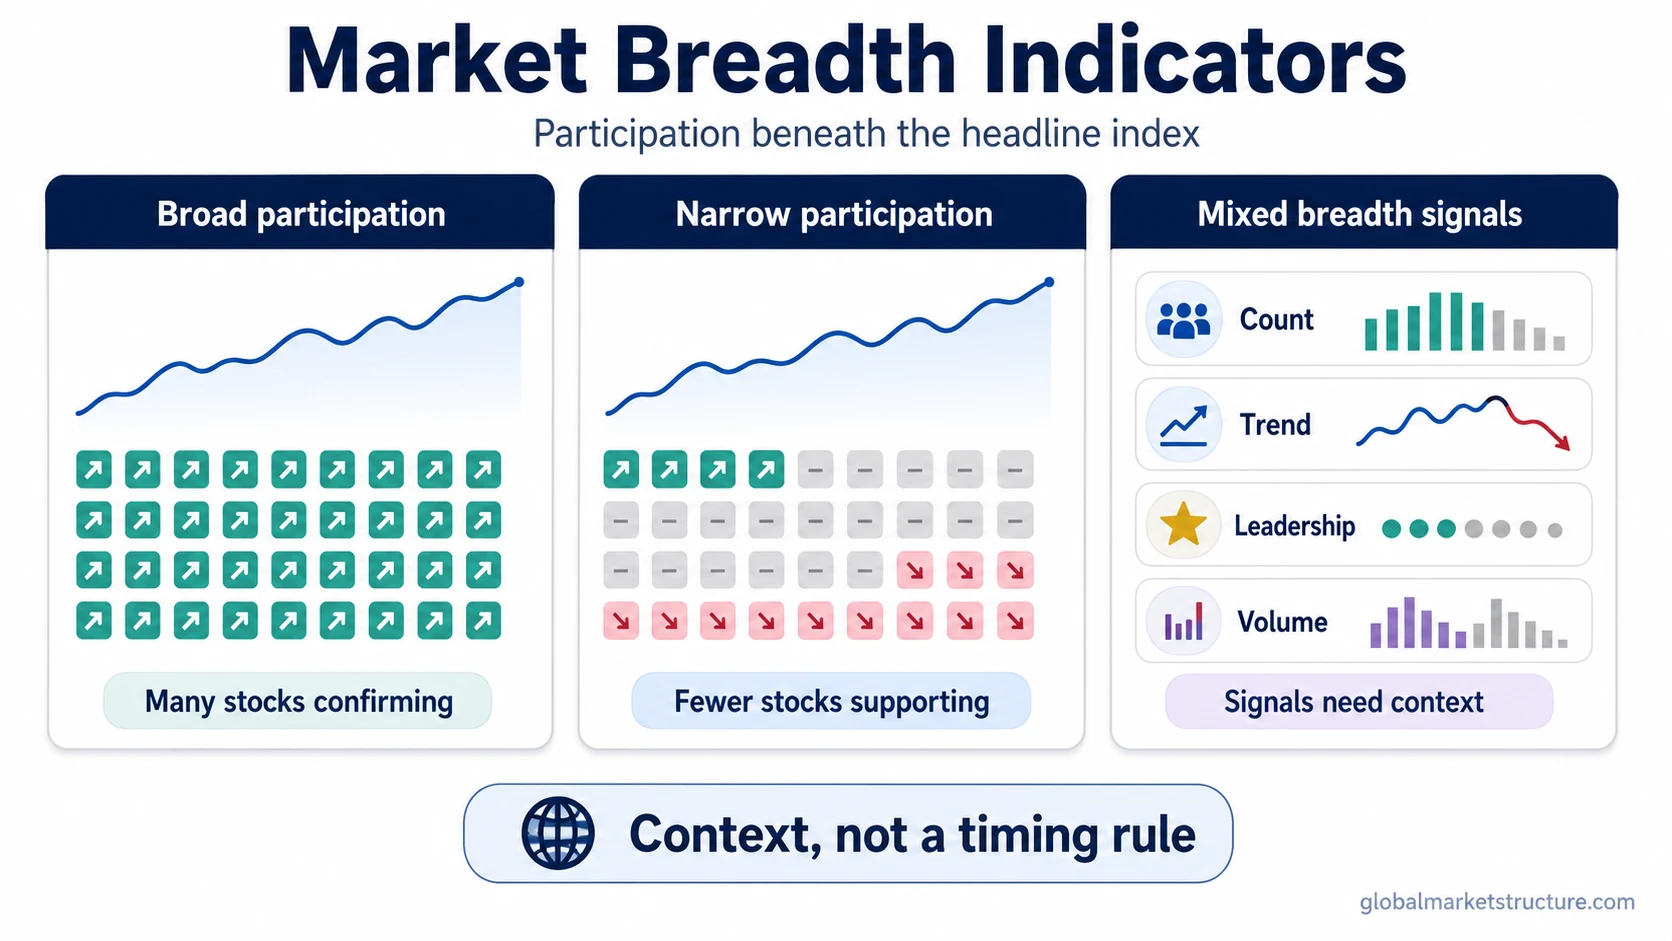
A rising index can be supported by broad participation, carried by a narrow group of large stocks, or accompanied by mixed internal evidence. Breadth indicators help separate those conditions by measuring counts, cumulative participation, leadership, trend participation, volume, and the speed of breadth repair.
Market Breadth Indicators Answer Different Participation Questions
- How many stocks are rising or falling?
- Is participation accumulating or deteriorating over time?
- Are new leaders expanding or are new lows spreading?
- How many stocks remain above important trend measures?
- Does volume support the advancing or declining side of the market?
- Is participation repairing quickly after a weak period?
What Market Breadth Indicators Measure
Market breadth indicators measure participation across a defined market universe rather than only the price movement of one security or index.
The universe can be an exchange, an index, a sector group, or another defined stock list. Different universes can produce different readings because they contain different securities and may use different data sources or component definitions.
The broader condition of participation across a market or defined group of securities.
Count-based, cumulative, trend, leadership, volume, and thrust measures used to observe different parts of that participation.
Main Market Breadth Indicator Families
No single family answers every participation question. A count-based measure and a long-term trend measure can move differently because they observe different dimensions and time horizons.
| Indicator family | What it measures | What it helps interpret | Main limitation |
|---|---|---|---|
| Advancers vs decliners | Daily count of rising stocks versus falling stocks | Whether a session has broad or weak participation | Can be noisy from day to day |
| A/D Line | Cumulative advancing issues minus declining issues | Whether participation confirms or diverges from index direction | Depends on the selected universe and exchange context |
| New highs / new lows | The balance between securities reaching new highs and new lows | Whether leadership is expanding or deterioration is becoming more widespread | The chosen lookback period and market universe affect the reading |
| Percent above moving averages | Share of stocks above medium-term or long-term trend measures | How much of the market remains in trend beneath the index | The moving-average length changes the interpretation |
| Up/down volume | Volume flowing through advancing stocks versus declining stocks | Whether volume participation favors the advancing or declining side | Volume can be concentrated in a smaller number of high-volume names |
| McClellan / breadth oscillator family | Momentum or acceleration in breadth data | Shorter-term changes in participation pressure | Formula and data-source differences can change the reading |
| Breadth thrust | Speed of participation repair after a weak period | Rapid improvement in broad participation | A thrust reading does not define the broader market regime by itself |
How Breadth Indicators Confirm or Diverge From Index Movement
Confirmation appears when the index and participation measures move in compatible directions. An index advance accompanied by broader advancers, an improving A/D Line, expanding new highs, and stronger trend participation has broader internal support than the index level alone would show.
Divergence appears when the index and participation stop confirming each other. An index can continue rising while the A/D Line flattens, new highs contract, or fewer stocks remain above longer-term trend measures.
The mismatch can persist or disappear as participation changes. Its value is in identifying a change in the internal structure of the move, not in fixing the timing of the next price move.
How to Read Conflicting Breadth Signals
Different breadth indicators can disagree without being logically inconsistent. A daily count can improve while long-term trend participation remains weak because the two measures observe different horizons. Volume breadth and stock-count breadth can also diverge when trading activity is concentrated in fewer names.
| Signal mix | Cleaner interpretation | What to check next |
|---|---|---|
| Index rising, A/D Line flat, new highs not expanding | Headline strength has weaker participation support | Leadership concentration, sector breadth, and trend participation |
| Daily advancers improving, long-term trend breadth still weak | Short-term participation may be repairing before longer-term trend breadth confirms | Whether improvement persists beyond the short-term reading |
| Up-volume strong but stock-count breadth narrow | Volume participation may be concentrated in fewer high-volume names | Whether volume support is broad or concentrated |
Why One Breadth Indicator Can Mislead
A single indicator can describe one part of participation accurately while giving an incomplete picture of the broader market.
Index weighting can create one source of disagreement. A capitalization-weighted index can remain firm while stock-count breadth is narrow because larger constituents have greater influence on the headline level. In that environment, breadth can be compared with narrow market leadership to separate broad participation from leadership dependency.
Universe selection creates another boundary. An exchange-wide A/D Line and a breadth measure based on a specific index can behave differently because they are not counting the same set of securities.
Time horizon also changes the picture. Daily advancers and decliners can move quickly, while the percentage of stocks above a long-term moving average changes more slowly. Volume-based measures add another dimension by measuring trading activity rather than stock counts alone.
Illustrative Breadth Reading
A capitalization-weighted index rises for several sessions while the A/D Line stops improving, new highs stop expanding, and fewer stocks remain above a long-term moving average. At the same time, up-volume is concentrated in a smaller group of large-cap leaders. Together, those readings describe a narrower participation base beneath the headline advance.
The reverse combination is also possible. The index can remain hesitant while daily participation, new-high data, and trend breadth begin to improve. That would describe internal repair before the headline index clearly reflects it.
How Breadth Indicators Fit Into Market Regime Interpretation
Breadth adds a participation layer to a broader risk-environment assessment. Broad participation can strengthen the internal support behind an index move, while deteriorating participation can make the headline more dependent on fewer drivers.
Liquidity conditions, credit behavior, sector leadership, volatility, and cross-asset confirmation can point in the same direction or contradict the breadth picture. Mixed evidence should remain mixed rather than being compressed into one directional conclusion.
This matters when index strength and participation disagree. The imbalance can resolve through broader participation, weaker index performance, consolidation, or a change in leadership. Breadth identifies the internal condition; the surrounding regime determines how much weight that condition deserves.
Related Breadth Concepts
A breadth thrust indicator focuses on rapid participation repair after weakness. It is one narrower member of the broader breadth-indicator toolkit rather than a replacement for the other families.
New highs and new lows, percent-above-moving-average measures, cumulative breadth, and volume breadth can describe different parts of the same participation environment. Agreement across several families can provide a more complete picture than one isolated reading.