
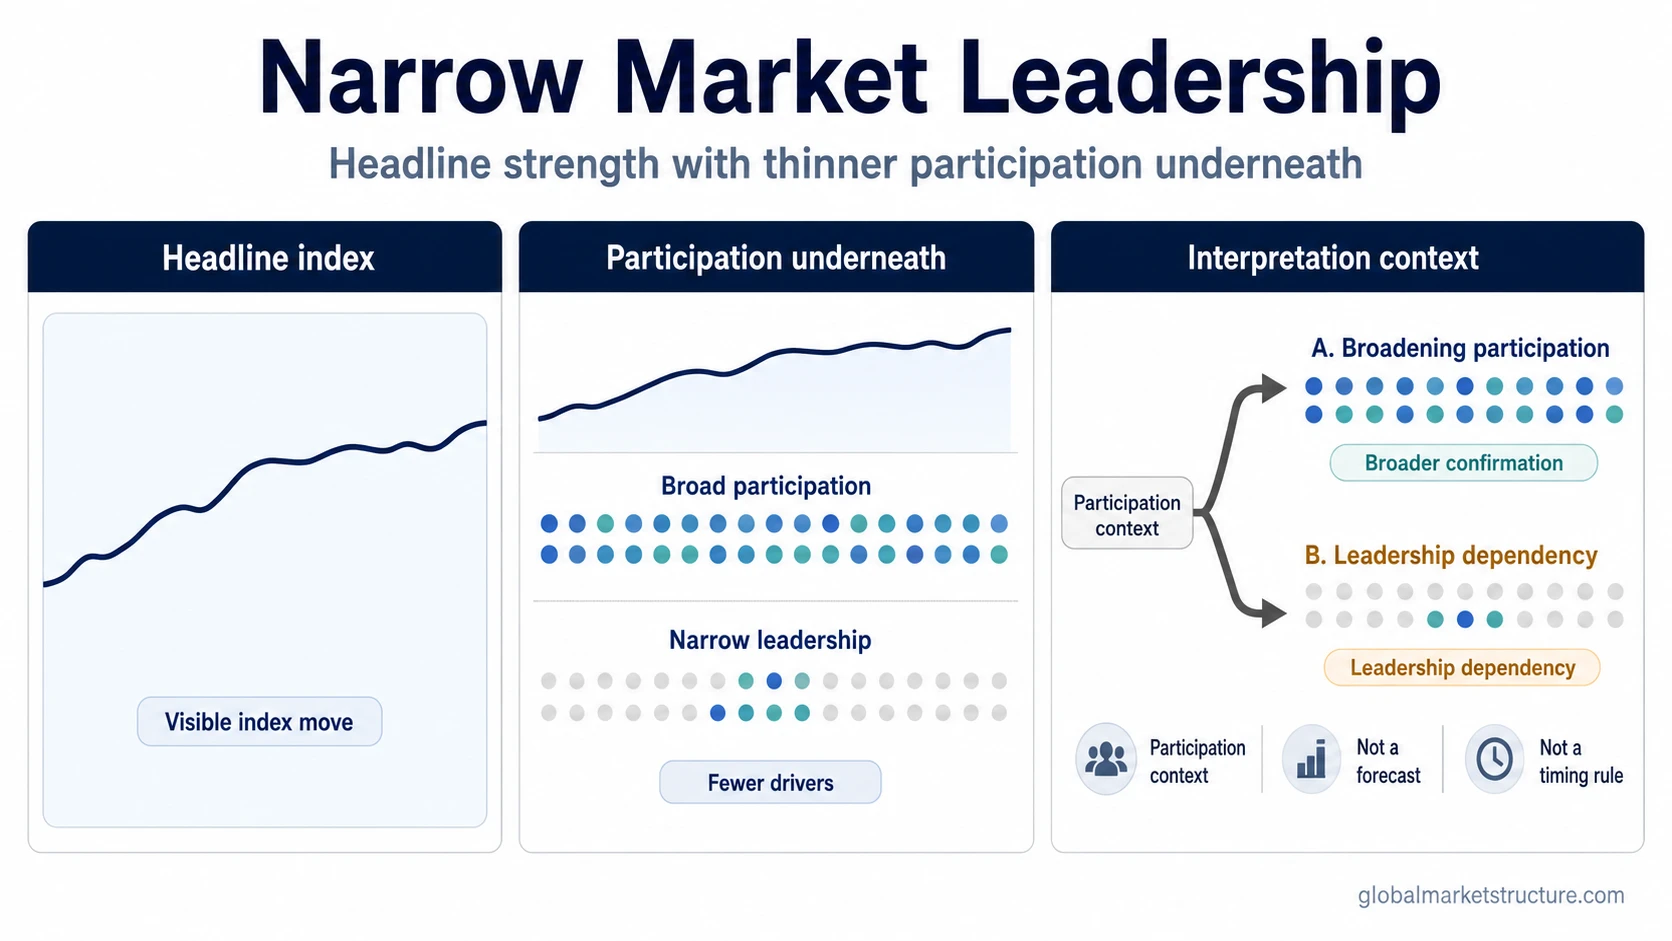
Narrow market leadership describes a market condition in which a smaller group of stocks, sectors, styles, themes, or index components drives a larger share of the visible market move. A headline index can remain strong while fewer groups contribute to that strength. The reading identifies who is carrying performance and how dependent the move is on those leaders.
What Narrow Market Leadership Reveals
A small group of leading stocks or sectors can have enough index influence to offset weaker performance elsewhere. The headline may continue higher even as other groups flatten, lag, or decline. This creates a difference between visible index performance and the distribution of strength underneath it.
Leadership can remain narrow for an extended period. The condition can also change when more stocks or sectors begin participating, or when the original leaders lose relative strength. Observing which path develops requires information beyond the index level alone.
A limited number of stocks, sectors, styles, or groups account for more of the visible market move through their relative performance.
A smaller group holds a disproportionately large share of index weight, capitalization, or exposure. The structural concentration can remain high even when current performance leadership broadens.
Market breadth adds a separate participation reading: how many constituents or groups are taking part in the move. Sector rotation describes shifts in relative leadership between sectors. These conditions may overlap without being interchangeable.
How the Leadership Reading Can Change
A firm index supported by a small leadership group can develop in several ways. The surrounding participation evidence determines whether the narrow condition is broadening, remaining stable, or losing support.
| Condition | What is visible | Interpretation |
|---|---|---|
| Leadership broadens | More stocks or groups begin contributing while the original leaders retain or share their influence. | The headline becomes supported by a wider participation base. Index concentration may still remain high. |
| Leadership remains narrow | A small group continues to lead while participation elsewhere is relatively flat or mixed. | Performance remains leadership-dependent, but the condition alone does not establish directional stress. |
| Leadership weakens | The leading group loses relative strength while broader participation remains thin or deteriorates. | Fewer drivers remain available to support the headline. The interpretation becomes more sensitive to the behavior of the remaining leaders. |
Checking Participation Beneath the Leaders
Consider an index that continues advancing while its leadership group becomes smaller. Several sectors stop making progress, and the remaining leaders account for more of the index move. The headline trend is still visible, but its participation base has narrowed.
One way to examine that difference is an advance-decline line. It tracks the cumulative balance of advancing and declining issues in a selected universe. A weakening line alongside a firm index can reveal non-confirmation, while improving participation can weaken the narrow-leadership interpretation.
The selected universe matters. An exchange-wide participation measure and an index-specific measure may reflect different constituent groups. Sector behavior, liquidity, risk appetite, and the broader cycle can add context when the leadership and breadth readings disagree.
A small leadership group can continue supporting the index, lose influence, or be joined by a broader set of participants. The condition alone does not establish a market top, crash, sell signal, or portfolio action. Changes in breadth, leader performance, liquidity, and the wider risk environment determine how the observation should be interpreted.