The Advance Decline Line is a cumulative market breadth indicator that tracks the net difference between advancing and declining issues over time. It helps show whether an index move is supported by broad participation or driven by a narrower group of components.
The basic idea is simple: when more issues rise than fall, the line moves higher. When more issues fall than rise, the line moves lower. The value comes from comparing that participation record with the behavior of the index itself. The A/D Line can reveal broadening participation, narrowing participation, or a mismatch between index performance and the number of components taking part.
The Advance Decline Line is not a standalone market-timing rule. It does not prove that a market must reverse, continue, rally, or decline. Its strongest role is to add breadth context to index-level movement.
What Is the Advance Decline Line?
The Advance Decline Line, often shortened to the A/D Line, is a cumulative measure of market breadth. It compares how many issues in a selected universe close higher with how many close lower, then adds the daily net result to the prior line value.
An advancing issue is a component that closes higher over the measurement period. A declining issue is a component that closes lower. The selected universe matters. An A/D Line built from NYSE-listed issues, S&P 500 components, Nasdaq components, or another index universe can produce different readings because each universe contains different securities.
Unlike a capitalization-weighted index, the A/D Line gives each issue one participation vote. That makes it useful for seeing whether price movement is broadly shared or concentrated in fewer components.
How the Advance Decline Line Is Calculated
The calculation starts with the net number of advancing issues. That net figure is then added to the prior A/D Line value, which makes the indicator cumulative rather than a one-period reading.
Advance Decline Line formula:
Current A/D Line = Prior A/D Line + (Advancing Issues - Declining Issues)
For example, if 1,700 issues advance and 1,200 decline, the net advance count is +500. That positive number is added to the prior A/D Line value. If 1,000 issues advance and 1,600 decline, the net result is -600, and the line moves lower by that amount.
Because the line is cumulative, one strong day does not define the full message. The more useful reading comes from the direction, persistence, and relationship between the A/D Line and the index being compared.
What the Advance Decline Line Shows About Participation
The A/D Line helps separate index-level movement from component-level participation. An index can rise while many components lag if the largest weighted stocks are strong enough to pull the index higher. The A/D Line can make that participation gap easier to see.
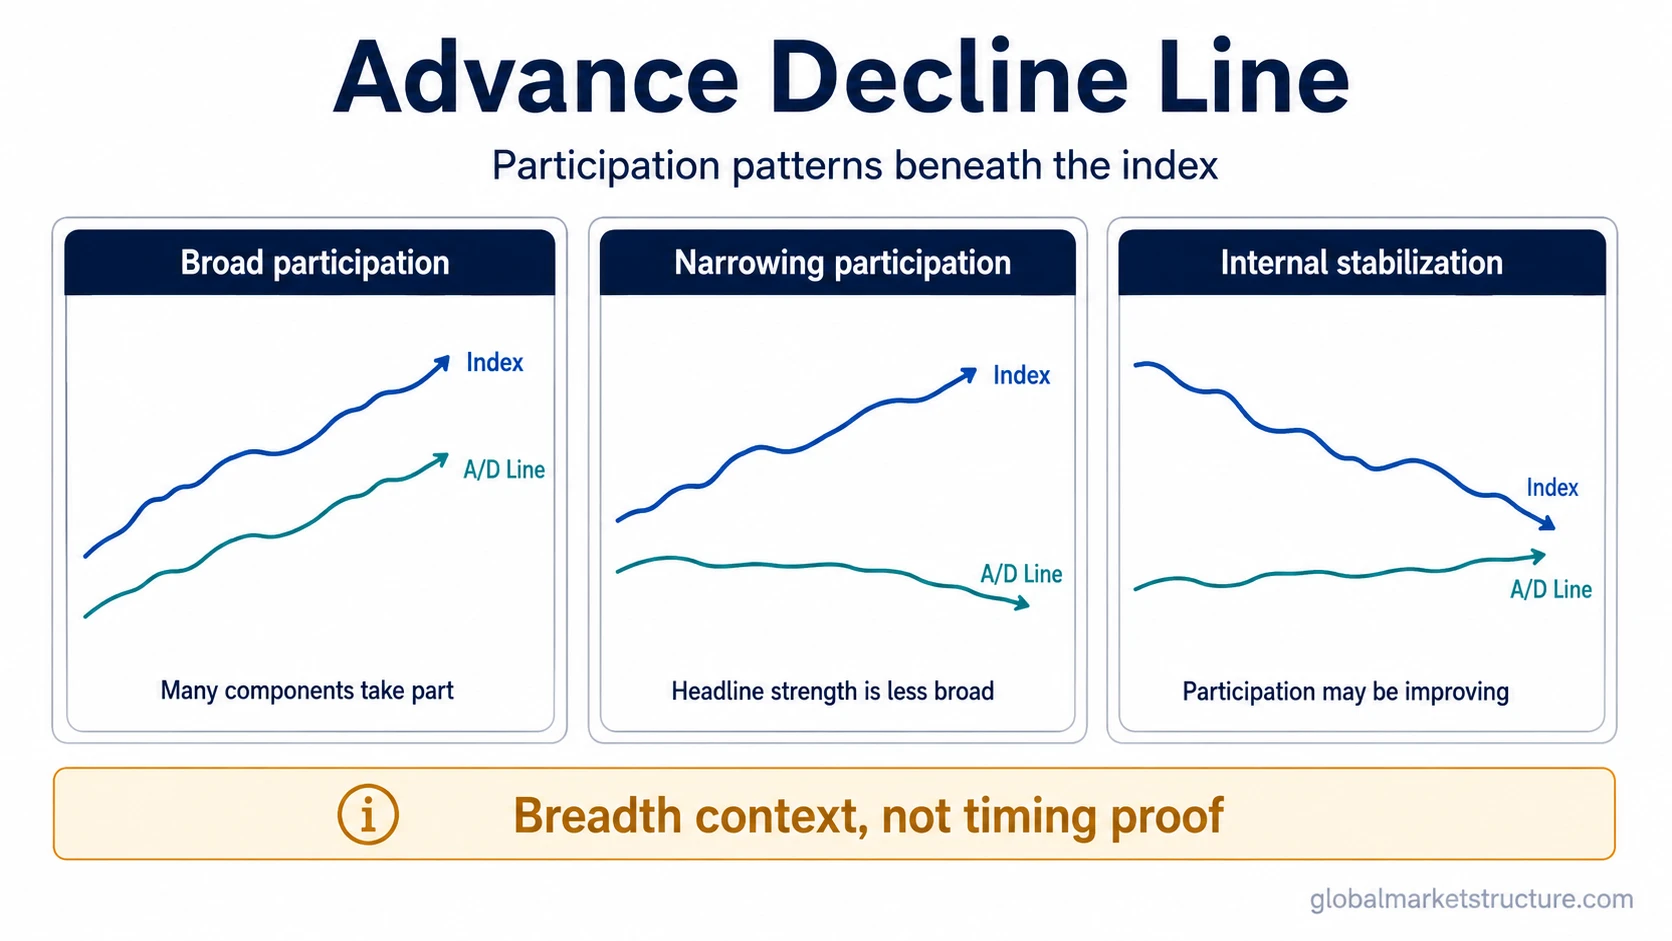
When the index and the A/D Line rise together, participation is usually broader. More components are taking part in the move, so the index advance is not limited to a small leadership group. When the index rises but the A/D Line flattens or declines, participation may be narrowing. That condition is closely related to narrow market leadership, where index strength depends more heavily on fewer components.
That does not make the index move invalid. It means the structure beneath the index is different from what the headline level alone suggests.
| A/D Line reading | Possible interpretation | Key limitation |
|---|---|---|
| Index rises and A/D Line rises | Participation is broadening across the selected universe. | Broad participation still does not guarantee trend continuation. |
| Index rises while A/D Line weakens | Index strength may be concentrated in fewer components. | The mismatch can persist for a long time in cap-weighted markets. |
| Index falls while A/D Line improves | Participation may be stabilizing beneath the index level. | Improvement in breadth does not prove that price has bottomed. |
| A/D Line moves sideways | Net participation may be balanced or indecisive. | Sideways breadth needs context from price, sector behavior, and data universe. |
How Divergence Appears
Divergence appears when the index and the A/D Line move in different directions. A common example is an index making higher highs while the A/D Line does not confirm those highs. That can suggest that fewer components are participating in the advance.
The opposite can also happen. An index may make lower lows while the A/D Line stops falling or begins improving. That can suggest that participation is becoming less weak beneath the surface.
This kind of mismatch is a form of breadth divergence. The important boundary is that divergence is a context signal, not proof of a turning point. Divergence can last, fail, or resolve only after other market conditions change.
What the A/D Line Does Not Prove
The A/D Line can show whether participation is strengthening or weakening, but it does not explain every reason behind that behavior. A declining A/D Line may reflect concentrated leadership, sector rotation, liquidity pressure, weak smaller components, or changes in the selected universe.
It also does not remove the need to understand index construction. A capitalization-weighted index can remain strong even if many smaller components are weak, as long as the largest components continue to rise. In that environment, the A/D Line may show participation risk before the index itself shows visible weakness, but that condition is still interpretive rather than conclusive.
Core limitation: A/D Line divergence can warn that participation is changing, but it does not prove a reversal, create an entry or exit rule, or predict market direction by itself.
The data universe is another limitation. A broad exchange-based A/D Line can behave differently from an index-specific A/D Line. Before interpreting the signal, the measured universe must be known.
Advance Decline Line vs Related Breadth Concepts
The Advance Decline Line is part of the broader market breadth family, but it should not be confused with every breadth measure. Different indicators answer different questions.
| Concept | What it measures | Main distinction from the A/D Line |
|---|---|---|
| Advance Decline Line | Cumulative net advancing issues minus declining issues. | Tracks participation over time as a running total. |
| Advance-decline ratio | Advancing issues compared with declining issues for a period. | Usually reads as a one-period ratio rather than a cumulative line. |
| Market breadth | The general condition of participation across components. | Broad category; the A/D Line is one specific breadth tool. |
| Arms Index / TRIN | Combines advance-decline data with volume context. | Adds a volume relationship rather than only counting issue direction. |
The A/D Line is most useful when it is treated as one participation lens inside a broader market-structure review. It becomes weaker when it is isolated from index construction, sector leadership, liquidity conditions, and the chosen data universe.
Practical Scenario: Rising Index, Narrowing Participation
A common scenario is an index rising while fewer components continue to advance. The headline index may look strong because large weighted components keep moving higher, but the A/D Line may flatten or fall because the broader component base is no longer participating as much.
That situation does not automatically mean the index must decline. It means the rise is becoming more dependent on a narrower leadership structure. The interpretation becomes stronger when the same participation weakness appears across related breadth measures, sector behavior, and risk-environment signals.
The opposite scenario can also matter. If an index is still under pressure but the A/D Line begins improving, participation may be stabilizing before the index fully reflects it. That is still a condition to evaluate, not a final conclusion.
Key Points
- The Advance Decline Line is a cumulative market breadth indicator based on advancing issues minus declining issues.
- It helps show whether index movement is supported by broad participation or concentrated in fewer components.
- The formula adds net advances, advancing issues minus declining issues, to the prior A/D Line value.
- Divergence between an index and the A/D Line can show a participation mismatch, but it does not prove a turning point.
- The selected data universe matters because different exchanges or index component groups can produce different breadth readings.
- The A/D Line is best used as a market-structure context tool, not as a standalone timing rule.
FAQ
What does the Advance Decline Line measure?
The Advance Decline Line measures the cumulative net difference between advancing and declining issues in a selected market universe. It shows whether participation is broadening, weakening, or diverging from the index being compared.
What is the Advance Decline Line formula?
The current A/D Line equals the prior A/D Line plus net advances, meaning advancing issues minus declining issues. The cumulative structure is what separates the A/D Line from a one-period advance-decline count.
What does A/D Line divergence mean?
A/D Line divergence means the index and the breadth line are moving differently. It can suggest that participation is changing beneath the index level, but it does not prove that the market must reverse or continue.
Is the Advance Decline Line a market-timing rule?
No. The Advance Decline Line is a breadth and participation indicator. It can add useful context, but it should not be treated as a standalone timing rule or a complete market decision framework.