A market cycle describes broad asset-market behavior as prices, participation, sentiment, liquidity, credit conditions, and risk appetite move through stronger and weaker phases. It helps classify market context, but it does not confirm exact timing, recession probability, allocation changes, or a trade signal.
Definition: A market cycle is an interpretive lens for organizing changes in asset-market behavior across phases of strength, stress, recovery, and transition.
It belongs to market-structure analysis because the label connects price action with broader inputs such as breadth, leadership, credit, liquidity, volatility, and investor risk appetite.
What It Means and What It Does Not Mean
| What a market cycle can mean | What it does not prove |
|---|---|
| It can describe whether market behavior is broadly expanding, weakening, correcting, recovering, or rotating. | It does not prove the exact phase, top, bottom, or next market move. |
| It can help organize evidence from price trends, breadth, credit, liquidity, sentiment, and participation. | It does not create a buy signal, sell signal, allocation rule, or recession forecast. |
| It can show how market conditions may change before or after the economy changes. | It is not the same thing as an official business-cycle date or an economic expansion or contraction label. |
What Is a Market Cycle?
A market cycle is the broad sequence of changing conditions in financial markets. It is usually described through stronger and weaker phases, but the useful point is not the phase label by itself. The useful point is the relationship between price behavior, participation, risk appetite, liquidity, and credit conditions.
For example, a market can rise while participation narrows, volatility changes, or credit conditions become less supportive. In that case, the market-cycle reading becomes more complex than a simple rising-price label. The cycle lens helps separate surface price movement from the wider structure behind that movement.
A market cycle is narrower than a complete investing system, trading setup, or standalone forecast. It classifies market context before deeper analysis begins.
How Market Cycles Are Commonly Described
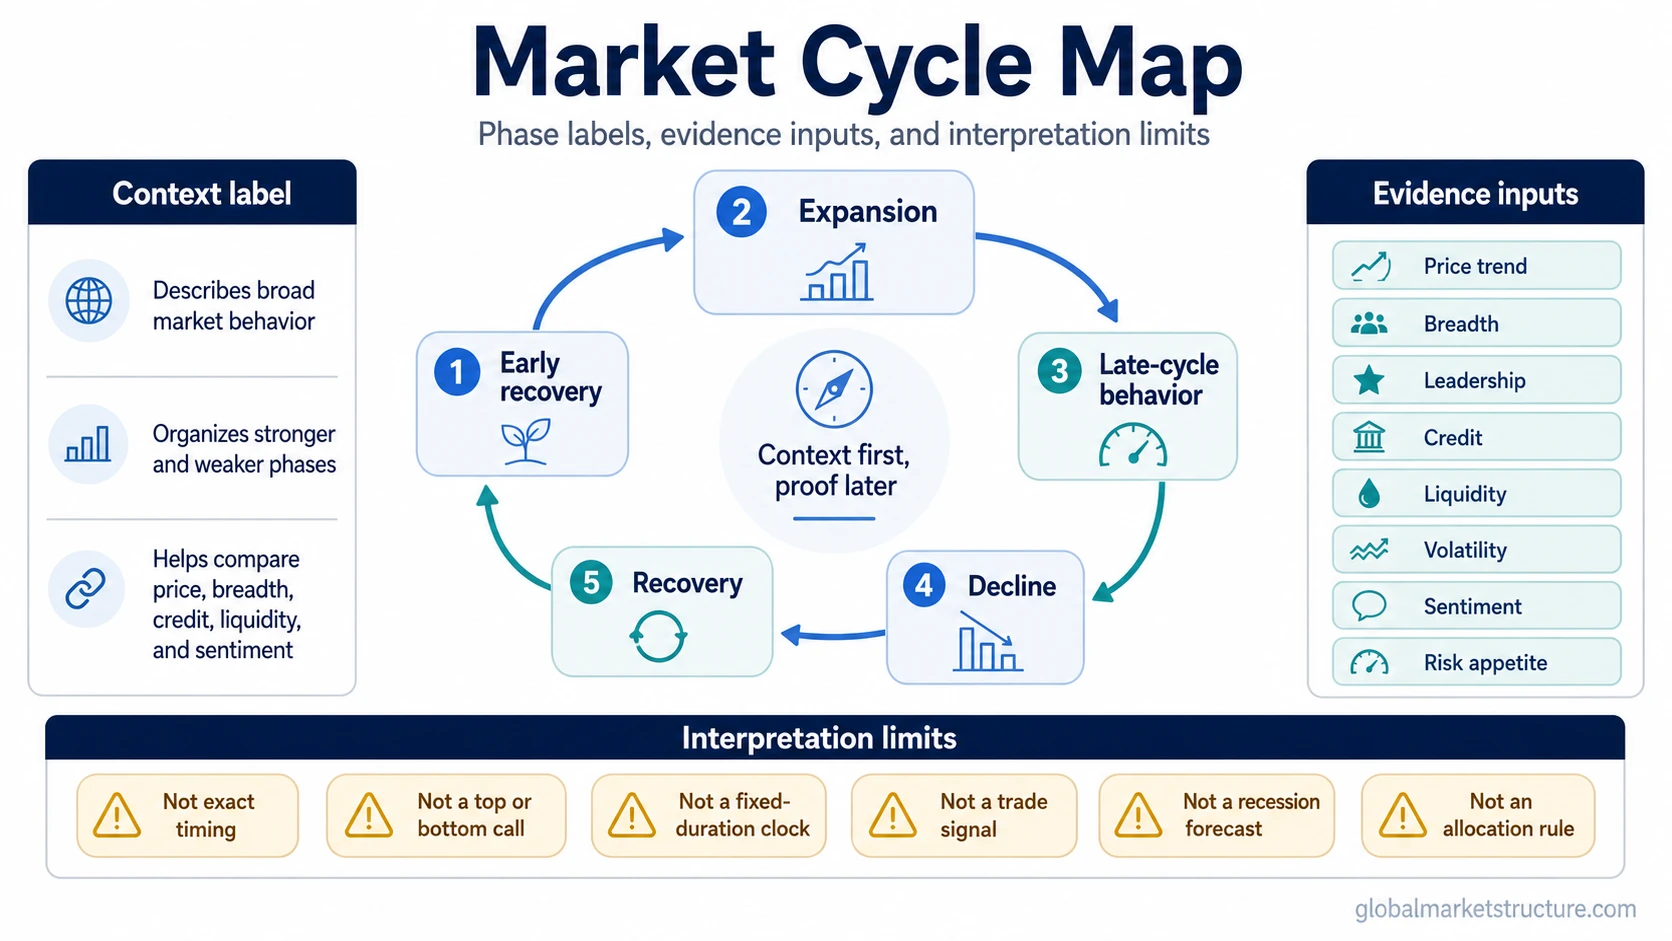
Market cycles are often described with labels such as accumulation, expansion, distribution, decline, contraction, recovery, bull phase, and bear phase. Different sources use different labels, so the exact wording is less important than the behavior being described.
A compact way to read the sequence is:
| Cycle description | Common market behavior | Interpretation limit |
|---|---|---|
| Early recovery or accumulation | Risk appetite begins to improve after prior weakness, but confidence may still be uneven. | The label does not confirm that a durable bull phase has started. |
| Expansion or broad advance | Price trends, participation, and risk appetite may strengthen together. | Strength can still hide later-cycle narrowing or excessive optimism. |
| Late-cycle or distribution behavior | Leadership may narrow, volatility may rise, and some internal measures may weaken. | Weakening evidence does not automatically prove a market top. |
| Decline or risk-off phase | Prices, breadth, liquidity, and risk appetite may deteriorate together. | A decline does not confirm how far markets will fall or when a bottom will form. |
| Repair or recovery | Volatility may ease, breadth may improve, and risk appetite may gradually return. | Repair does not prove that all prior risks have disappeared. |
The sequence should not be treated as a mechanical clock. Markets can pause, reverse, compress, extend, or rotate across assets. A cycle label is a context label, not a calendar.
What a Market-Cycle Label Does Not Prove
Limit: A market-cycle label does not prove exact timing, a market top, a market bottom, recession probability, allocation action, or trade direction.
The most common mistake is using a phase label as if it were a complete decision rule. A market may look late-cycle in some internal measures while the main index remains strong. Another market may show early recovery behavior while credit conditions, liquidity, or policy uncertainty still make the interpretation fragile.
The label becomes more useful when it is supported by several independent inputs. It becomes weaker when it depends on one chart, one asset class, one sentiment reading, or one simplified phase diagram.
Market Cycle vs Nearby Cycle Concepts
A market cycle is related to several nearby cycle concepts, but it should not be merged with them. Each lens answers a different question.
| Concept | Main focus | How it differs from a market cycle |
|---|---|---|
| Business cycle | Economic activity, expansion, contraction, peaks, and troughs. | It describes the economy, while a market cycle describes asset-market behavior. |
| Stock cycle | Equity-market participation, leadership, and price behavior. | It is more focused on stocks, while a market cycle can include broader asset behavior. |
| Credit cycle | Lending conditions, leverage, default risk, and credit availability. | It can drive or confirm market-cycle pressure, but it is not the whole market cycle. |
| Boom-and-bust cycle | Speculative excess, rapid expansion, instability, and unwind risk. | It is a more extreme pattern, while a market cycle can include normal transitions. |
The comparison that matters most for many readers is market cycle vs business cycle, because markets and the economy can move with different timing.
Evidence Used to Interpret Market Cycles
Market-cycle analysis works best when the phase label is checked against multiple evidence inputs. No single input is enough by itself.
| Evidence input | What it can show | What to avoid |
|---|---|---|
| Price trend | Whether the broad direction of major assets is improving, weakening, or rotating. | Do not treat price direction alone as proof of the cycle phase. |
| Market breadth | Whether participation is broad or concentrated in fewer leaders. | Do not assume a narrow market must immediately reverse. |
| Leadership | Which sectors, styles, or assets are carrying the advance or decline. | Do not confuse leadership rotation with a complete cycle turn. |
| Credit conditions | Whether risk pricing, spreads, or lending appetite are supporting or pressuring markets. | Do not treat credit stress as a precise timing tool. |
| Liquidity conditions | Whether financing, market depth, and policy conditions are supportive or restrictive. | Do not assume liquidity explains every market move by itself. |
| Volatility and sentiment | Whether risk appetite is calm, stressed, euphoric, or fragile. | Do not use sentiment extremes as automatic reversal signals. |
The reading becomes stronger when several inputs align. It becomes weaker when the evidence is mixed, when one asset class dominates the conclusion, or when the phase label is used without a clear mechanism.
Practical Scenario: Useful Context, Not Timing Proof
A common scenario is that headline equity indices continue rising while fewer sectors participate, credit spreads stop improving, volatility becomes more unstable, and liquidity conditions become less supportive. That does not prove a top. It does, however, make the market-cycle reading more cautious because surface price strength is no longer confirmed by the same depth of participation and risk support.
The same logic can work in the other direction. A market can still look weak on the surface while breadth improves, volatility calms, leadership broadens, and credit pressure eases. That does not prove a bottom, but it can suggest that repair is developing beneath the headline index.
The value of the market-cycle lens is that it keeps these inputs together. It prevents the reader from treating one phase label, one chart, or one macro opinion as a complete market view.
Related Cycle Concepts
Market cycles sit inside a broader cycle framework. Economic activity belongs to the business-cycle lens. Equity-market stage behavior belongs to the stock-cycle lens. Lending, leverage, and credit availability belong to the credit-cycle lens. Speculative excess and unwind risk belong to the boom-and-bust lens.
The important boundary is simple: market cycle is a broad asset-market behavior lens. Nearby cycle concepts can explain parts of that behavior, but they should not replace the broader classification.
FAQ
What is a market cycle?
A market cycle is a broad pattern of asset-market behavior across stronger and weaker phases of price trend, participation, sentiment, liquidity, credit conditions, and risk appetite. It is a classification lens, not a timing signal.
Is a market cycle the same as a business cycle?
No. A market cycle describes asset-market behavior, while a business cycle describes economic activity. Markets can lead, lag, or diverge from the economy.
How long does a market cycle last?
There is no fixed duration. Market cycles can vary by asset class, liquidity environment, policy backdrop, credit conditions, and investor behavior. A cycle label should not be treated as a calendar.
Can market cycles predict market tops or bottoms?
No. Market-cycle analysis can help organize evidence, but it cannot confirm exact tops, bottoms, timing, future returns, or trade direction by itself.
What evidence is useful when interpreting a market cycle?
Useful evidence can include price trend, breadth, leadership, credit conditions, liquidity, rates, volatility, risk appetite, positioning, and sentiment. The reading is stronger when several independent inputs point in the same direction.