A stock cycle classifies recurring stock-market behavior across phases such as accumulation, advance or markup, distribution, and decline or markdown. It describes how equity prices, participation, sentiment, and risk appetite may change over time. A stock cycle is not a buy/sell rule, a recession forecast, or a mechanical timing signal.
Key Points
- A stock cycle refers to stock-market behavior, not inventory “cycle stock.”
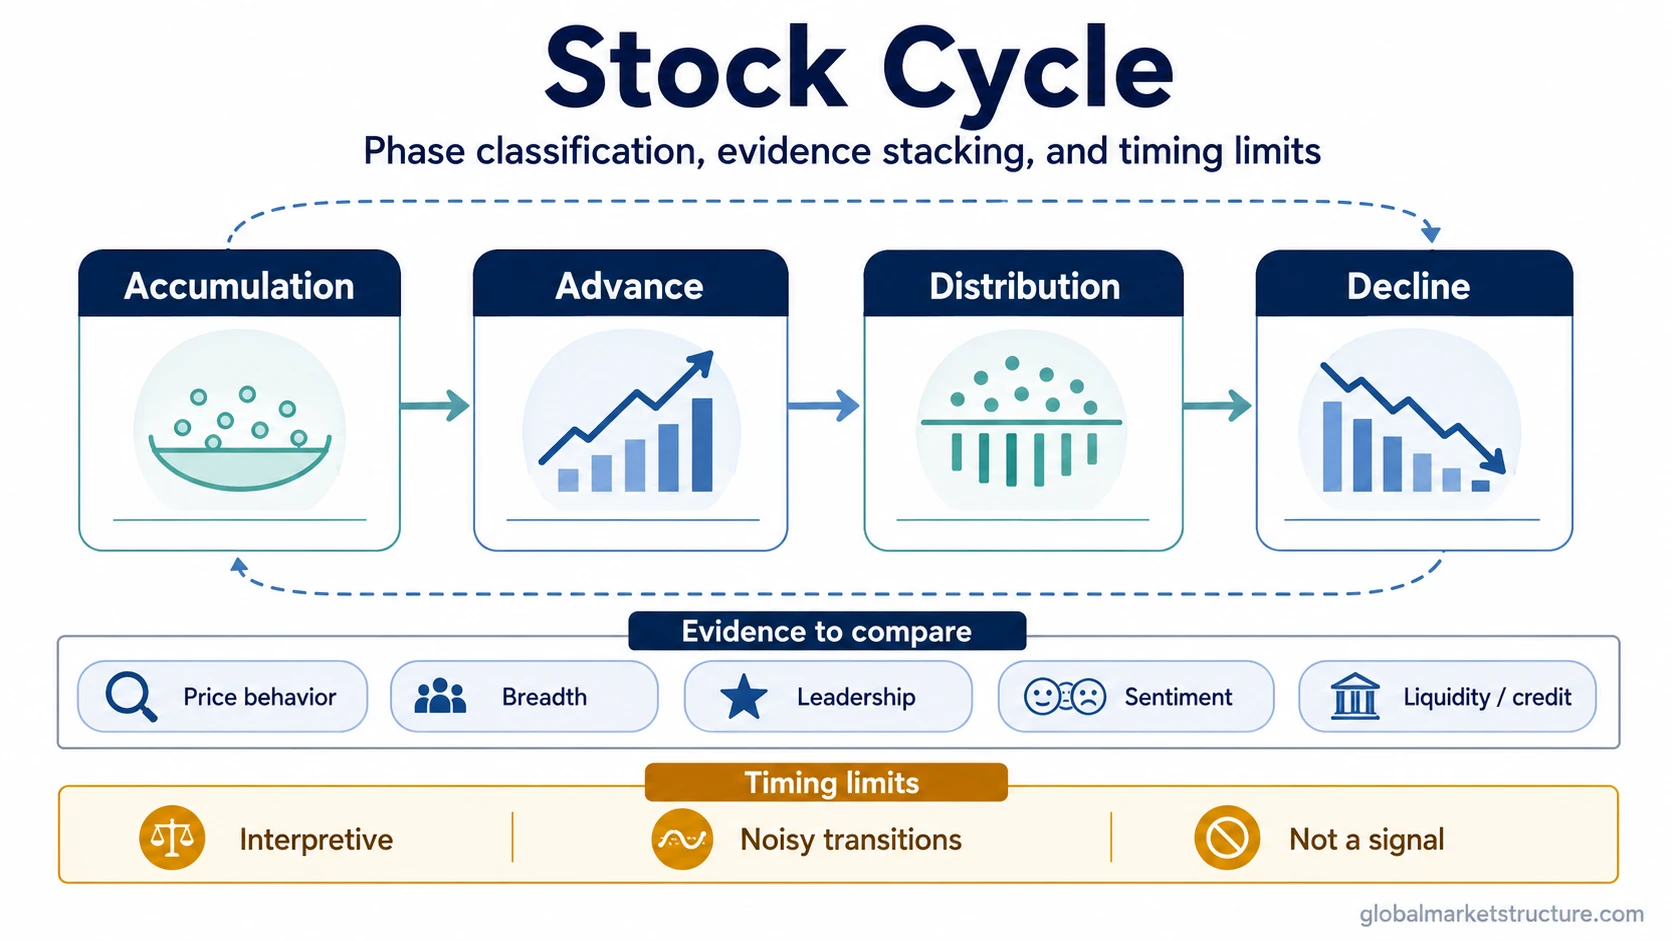
- Common phase labels include accumulation, advance or markup, distribution, and decline or markdown.
- Phase labels organize market behavior, but they are interpretive and often clearer in hindsight.
- A stock-cycle view becomes more useful when price behavior is compared with breadth, participation, sentiment, liquidity, and credit conditions.
- No stock-cycle phase creates a stand-alone buy/sell signal, portfolio rule, or recession forecast.
What a Stock Cycle Is and Is Not
A stock cycle is a classification tool for equity-market behavior. It helps describe whether the stock market appears to be stabilizing, advancing, distributing, or declining. The concept becomes risky when a phase label is treated as a precise instruction or a forecast.
| Reading | Safe interpretation | What not to infer |
|---|---|---|
| Stock-cycle phase | A label for observed or developing stock-market behavior. | That the next turning point is known. |
| Market cycle | A broader financial-market cycle that may include equities, credit, rates, liquidity, and risk appetite. | That equity behavior alone explains the entire market environment. |
| Business cycle | An economy-wide expansion and contraction process involving growth, employment, income, production, and demand. | That stock prices and economic data always move at the same time. |
| Trading strategy | A separate decision framework with rules, risk, confirmation, and invalidation. | That a stock-cycle label tells someone when to enter or exit. |
| Forecast model | A prediction framework that requires separate evidence and testing. | That cycle labels reliably predict dates, recessions, rallies, or crashes. |
| Inventory “cycle stock” | A supply-chain and inventory-management term. | That inventory cycle stock is the meaning intended in stock-market cycle analysis. |
How a Stock Cycle Is Usually Described
Stock cycles are often described with four broad phase labels. The labels give structure to changing market behavior, but real markets do not move in clean textbook stages.
| Phase | Typical stock-market behavior | Evidence people watch | Main limitation |
|---|---|---|---|
| Accumulation | Prices may stabilize after weakness while selling pressure becomes less dominant and buying interest begins to absorb available supply. | Stabilization, improving participation, reduced downside pressure, early leadership repair. | Stabilization can fail, and accumulation is often easier to label after the fact. |
| Advance / markup | Prices rise more persistently as participation and risk appetite improve. | Broader participation, improving breadth, stronger leadership, constructive sentiment. | A rising market can still be narrow, liquidity-dependent, or vulnerable to reversal. |
| Distribution | Prices may hold up while participation weakens and leadership becomes more selective. | Narrower breadth, fading momentum, weaker internal quality, risk appetite losing strength. | Distribution is not confirmed by one reversal, one weak sector, or one volume pattern. |
| Decline / markdown | Prices fall as selling pressure, risk aversion, or forced de-risking becomes more visible. | Lower highs, weaker participation, deteriorating breadth, defensive behavior, fragile sentiment. | A decline does not automatically identify the next bottom or prove a recession is coming. |
The phase sequence can make stock-market behavior easier to discuss, but it should not be read as a fixed calendar. A market can transition slowly, retest prior conditions, or show mixed signals across different sectors and indexes.
What Evidence Can Support a Stock-Cycle View?
A stock-cycle view becomes stronger when several types of evidence point in the same direction. Price trend matters, but price alone can be misleading when participation is narrow or liquidity conditions are changing.
Useful evidence can include price behavior, market breadth, leadership quality, sentiment, volume context, and risk appetite. Broader conditions can also matter. For example, a tightening credit cycle may weaken a bullish stock-cycle interpretation if funding pressure or wider credit spreads begin to conflict with rising equity prices.
The safer method is evidence stacking, not mechanical confirmation. A single indicator may support a phase label, but it should not be treated as proof that a phase has changed.
Why Stock Cycles Can Differ From Business Cycles
A stock cycle focuses on equity-market behavior. A business cycle focuses on economy-wide activity, such as growth, production, income, employment, and demand. The two can overlap, but they are not the same object.
Stock prices can move on expectations before economic data clearly changes. They can also respond to liquidity, interest-rate expectations, risk appetite, earnings expectations, positioning, and discount-rate shifts. For that reason, stock-market phases may appear to lead, lag, or diverge from the business cycle depending on the surrounding evidence.
This distinction matters because a stock-cycle label should not be used as a shortcut for economic diagnosis. A rising stock market does not automatically mean the economy is expanding cleanly, and a falling stock market does not automatically prove that a recession has started.
Illustrative Scenario: Mixed Evidence Around a Possible Turn
A market may stop making new lows after a long decline while a few leading groups begin to recover. That can look like early accumulation. The signal is weaker if breadth remains narrow, credit conditions are tightening, and most stocks are still not participating.
The same price stabilization can mean early repair, temporary relief, or unfinished distribution depending on the wider evidence. A phase label is most useful when it keeps that uncertainty visible instead of pretending the turn has already been proven.
Common Mistakes With Stock Cycles
The first mistake is treating a phase label as a direct action signal. Accumulation does not automatically mean buy, distribution does not automatically mean sell, and decline does not automatically mean short.
The second mistake is confusing a stock cycle with the broader market cycle. Equity behavior can be central, but broader market conditions may also involve rates, credit, liquidity, volatility, and cross-asset risk appetite.
The third mistake is reading the stock cycle as a fixed timetable. Some cycles compress, others stretch, and some phases become visible only after multiple pieces of evidence have already changed.
The fourth mistake is confusing normal stock-cycle classification with a boom-and-bust cycle. A boom-and-bust structure describes a more extreme pattern of speculative expansion and collapse, while a stock cycle can describe broader recurring equity-market phase behavior without implying mania or crash dynamics.
Limits of Stock-Cycle Labels
Stock-cycle labels help organize market evidence, but they do not remove timing uncertainty. They are often clearer in hindsight, transitions can be noisy, and different parts of the market can show different phase behavior at the same time.
A useful stock-cycle view stays conditional. It becomes more meaningful when price behavior aligns with participation, breadth, leadership quality, sentiment, and liquidity or credit context. It becomes weaker when the evidence is narrow, contradictory, or based on one indicator.
Related Concepts
Stock cycles sit inside the broader cycle-foundation layer. The closest related concepts are market cycle, business cycle, credit cycle, and boom-and-bust cycle. Each concept answers a different question: equity behavior, broad market behavior, economy-wide activity, credit conditions, or extreme speculative expansion and collapse.