A boom and bust cycle is a rapid expansion in activity, asset prices, credit, or confidence followed by a sharp contraction. The label helps classify an unstable expansion-to-contraction pattern, but it does not identify the exact turning point, forecast a recession date, or create a buy or sell rule.
Simple definition: a boom and bust cycle describes a fast build-up followed by a sharper reversal when financing, confidence, demand, or risk appetite weakens.
- The pattern can involve credit, liquidity, confidence, demand, leverage, investment, and expectations.
- It can appear in markets, credit conditions, sentiment, or the broader economy.
- It is a context label, not a timing model, recession forecast, or trading signal.
How a Boom and Bust Cycle Works
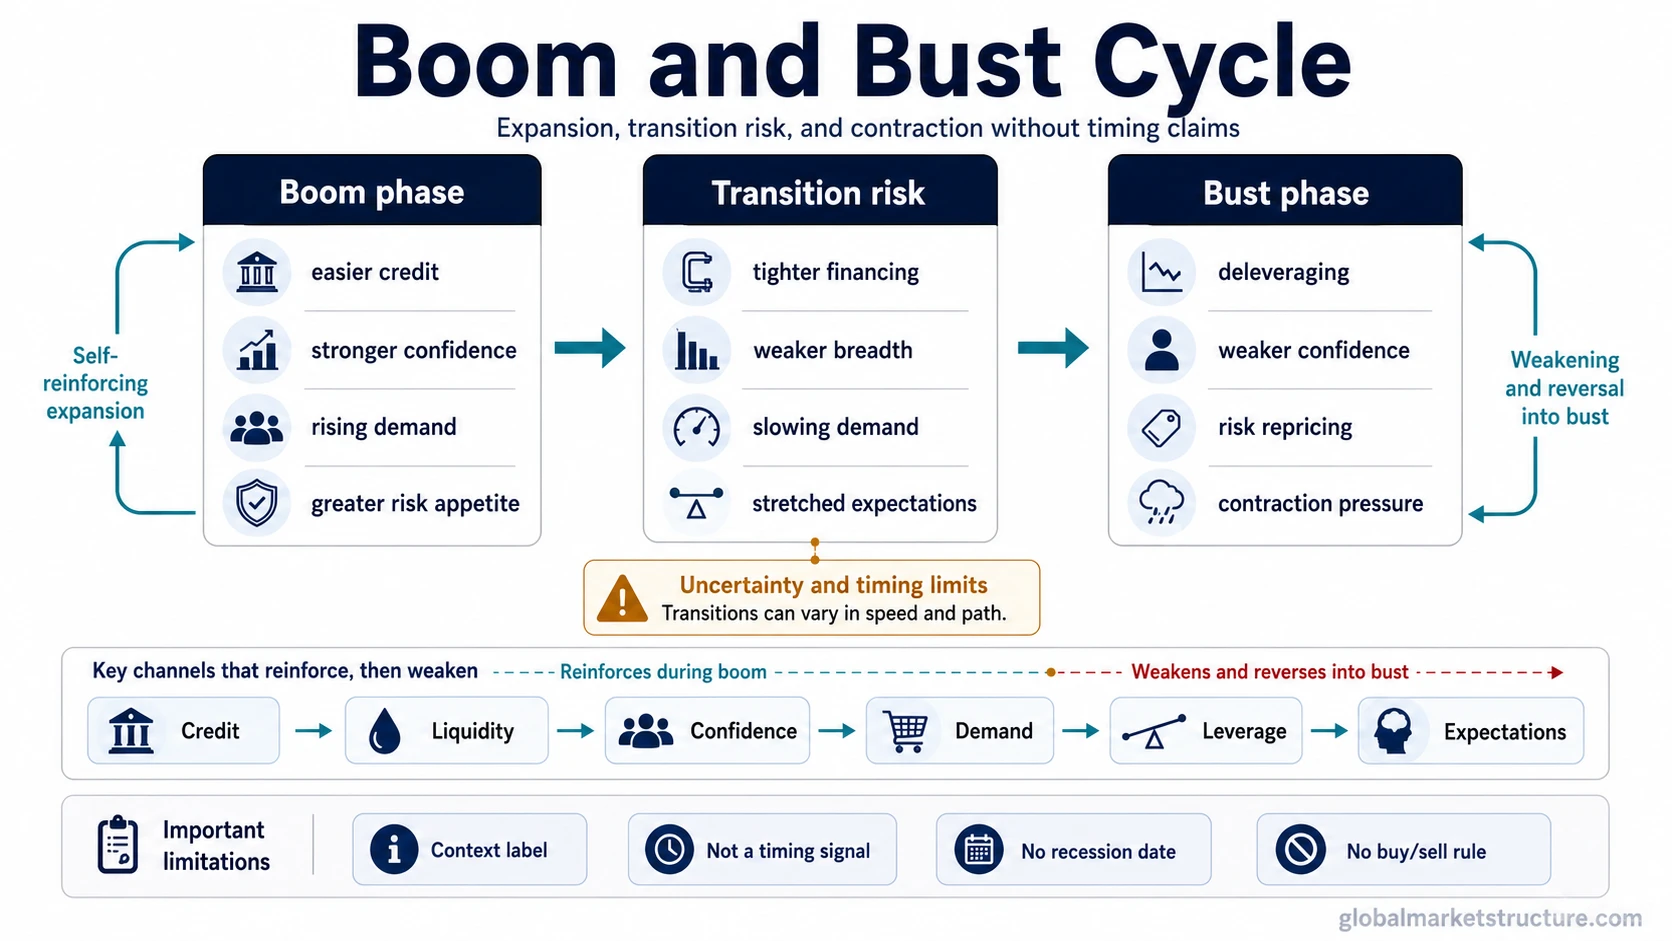
A boom usually begins when conditions reinforce expansion. Credit may become easier to obtain, liquidity may feel abundant, confidence may rise, and demand may strengthen. As those forces support each other, investment and risk-taking can increase. Expectations then become part of the mechanism because participants begin to treat the stronger environment as normal.
The bust begins when the same reinforcing process weakens or reverses. Financing can become harder, confidence can fall, demand can slow, and leveraged participants may reduce exposure. A boom-bust pattern is therefore not only about growth followed by weakness. It is about a self-reinforcing expansion that becomes vulnerable when the support structure changes.
| Stage | Typical pressure | Market-structure interpretation |
|---|---|---|
| Boom phase | Easier credit, stronger confidence, rising demand, greater risk appetite | Expansion is being reinforced by liquidity, expectations, and participation. |
| Transition risk | Financing tightens, breadth weakens, demand slows, expectations become stretched | The cycle may be losing internal support, but timing remains uncertain. |
| Bust phase | Deleveraging, weaker confidence, risk repricing, contraction in activity or prices | The prior expansion is being unwound rather than merely slowing. |
Boom and Bust Cycle vs Nearby Cycle Concepts
A boom and bust cycle overlaps with other cycle terms, but it should not replace them. The useful distinction is the sharp expansion-to-contraction pattern. A broader market cycle describes how markets move through phases over time, while a boom-bust label focuses on the instability of a rapid build-up and reversal.
| Concept | What it describes | What it can overlap with | What not to confuse it with |
|---|---|---|---|
| Boom and bust cycle | A rapid expansion followed by a sharp contraction. | Credit, asset prices, confidence, demand, and broad market environment. | A precise timing tool or recession forecast. |
| Market cycle | The broader sequence of market phases and risk environments. | Booms and busts in asset prices or sentiment. | A guarantee that each phase follows a fixed calendar. |
| Business cycle | Macro expansion and contraction in the real economy. | Economic booms, slowdowns, recessions, and recoveries. | Every asset-price boom or speculative reversal. |
| Stock cycle | Equity-market phase behavior across accumulation, advance, distribution, and decline. | Equity booms and equity busts. | The full macro economy or all credit conditions. |
| Credit cycle | Changes in lending, borrowing, leverage, and financing conditions. | The credit channel that can amplify both boom and bust phases. | A complete explanation of every market-cycle move by itself. |
Evidence That Can Suggest a Boom Is Weakening
A boom does not become a bust simply because prices are high, growth has lasted a long time, or sentiment looks optimistic. The interpretation becomes more serious when several types of evidence begin to weaken together. That evidence can include tighter financing, credit deterioration, lower liquidity, weaker breadth, slowing demand, labor-market softness, or a shift away from risk appetite.
Early evidence is not the same as confirmation. A leading indicator can warn that conditions are changing before the broad data confirms it, while a lagging indicator may confirm the change only after the cycle has already moved. This timing gap is one reason boom-bust labels should be used as context, not as mechanical signals.
| Evidence area | What weakening can suggest | Important limitation |
|---|---|---|
| Credit | Borrowing conditions may be tightening or lenders may be becoming more cautious. | Credit stress can build slowly before it affects the wider economy. |
| Liquidity | Participants may have less ability or willingness to finance risk. | Liquidity can look stable until pressure becomes concentrated. |
| Market breadth | Fewer areas may be participating in the boom. | Narrow leadership can persist longer than expected. |
| Demand | Real activity may be slowing beneath strong headline sentiment. | Demand signals vary by sector and time horizon. |
| Risk appetite | Investors may be moving away from speculative or cyclical exposure. | Risk-off behavior needs confirmation from surrounding conditions. |
Common False Readings
The biggest mistake is treating the boom-bust label as a timing device. A cycle can be vulnerable without reversing immediately. A bust can begin in one area while another part of the market still appears strong. The label is useful because it organizes context, not because it removes uncertainty.
Interpretation limit: a boom and bust cycle is not a fixed phase calendar, not a recession forecast, not a buy or sell signal, and not always the same thing as the business cycle. It is a way to describe an unstable expansion and contraction pattern after the evidence supports that interpretation.
Another false reading is assuming every boom has the same cause. Some booms are driven mainly by credit expansion, some by policy conditions, some by speculative expectations, and some by a real demand surge that later becomes overextended. The bust also varies. It may come through tighter financing, demand weakness, falling confidence, deleveraging, or a combination of these channels.
Boom and Bust Cycle Example in Context
Consider a generic environment where financing becomes easier, businesses and investors grow more confident, and demand rises faster than expected. More participants assume the expansion will continue, so borrowing, investment, and risk-taking increase. Later, financing costs rise, demand slows, and confidence weakens. The same leverage and expectations that supported the boom can then amplify the contraction.
This scenario can help explain a boom-bust structure, but it still does not identify the exact turning point. The pattern becomes more credible when several channels deteriorate together, not when one isolated signal changes.
Related Concepts
A boom and bust cycle is easiest to understand inside the wider cycle map. Use the business cycle when the focus is the real economy, the credit cycle when the focus is financing and leverage, and the stock cycle when the focus is equity-market phase behavior.
- For broad market phases: start with the market cycle.
- For macro expansion and contraction: use the business cycle.
- For lending, leverage, and financing pressure: use the credit cycle.
- For equity-market phase behavior: use the stock cycle.
- For leadership changes during cycle shifts: sector rotation can be reviewed after the main cycle context is clear.
FAQ
What is a boom and bust cycle?
A boom and bust cycle is a rapid expansion followed by a sharp contraction. It can appear in economic activity, credit, asset prices, confidence, or risk appetite. The term describes the pattern, not the exact timing of the reversal.
What causes a boom and bust cycle?
A boom and bust cycle can be driven by easier credit, abundant liquidity, rising confidence, stronger demand, leverage, investment, and optimistic expectations. The bust can develop when those supports weaken or reverse.
Is a boom and bust cycle the same as a business cycle?
No. A business cycle describes broad macro expansion and contraction. A boom and bust cycle focuses on a sharper expansion-to-contraction pattern that may appear in the economy, credit conditions, asset prices, or market sentiment.
Does a boom and bust cycle predict a recession?
No. A boom-bust label can describe a vulnerable or unstable cycle structure, but it does not forecast the timing of a recession. Recession analysis requires separate evidence from macro, labor, credit, demand, and policy conditions.
Can investors use a boom and bust cycle as a trading signal?
No. The concept is better used as market-structure context. It can help classify the environment, but it does not create a buy signal, sell signal, entry rule, exit rule, or portfolio instruction.