Value stocks are shares that usually trade at lower valuations relative to fundamentals, assets, earnings, cash flow, dividends, or market expectations. In market-cycle analysis, they are an equity style category used to compare leadership against growth stocks and other risk exposures. A value label can help describe style rotation, but it does not prove undervaluation, future upside, safety, timing, or the current cycle phase.
Key Points
- Value stocks are usually priced lower relative to fundamentals or expectations, but low valuation is not proof of mispricing.
- Value is an equity style category, not a recommendation, allocation rule, or buy signal.
- Value stocks are commonly contrasted with growth stocks, which are usually priced more around expected future expansion.
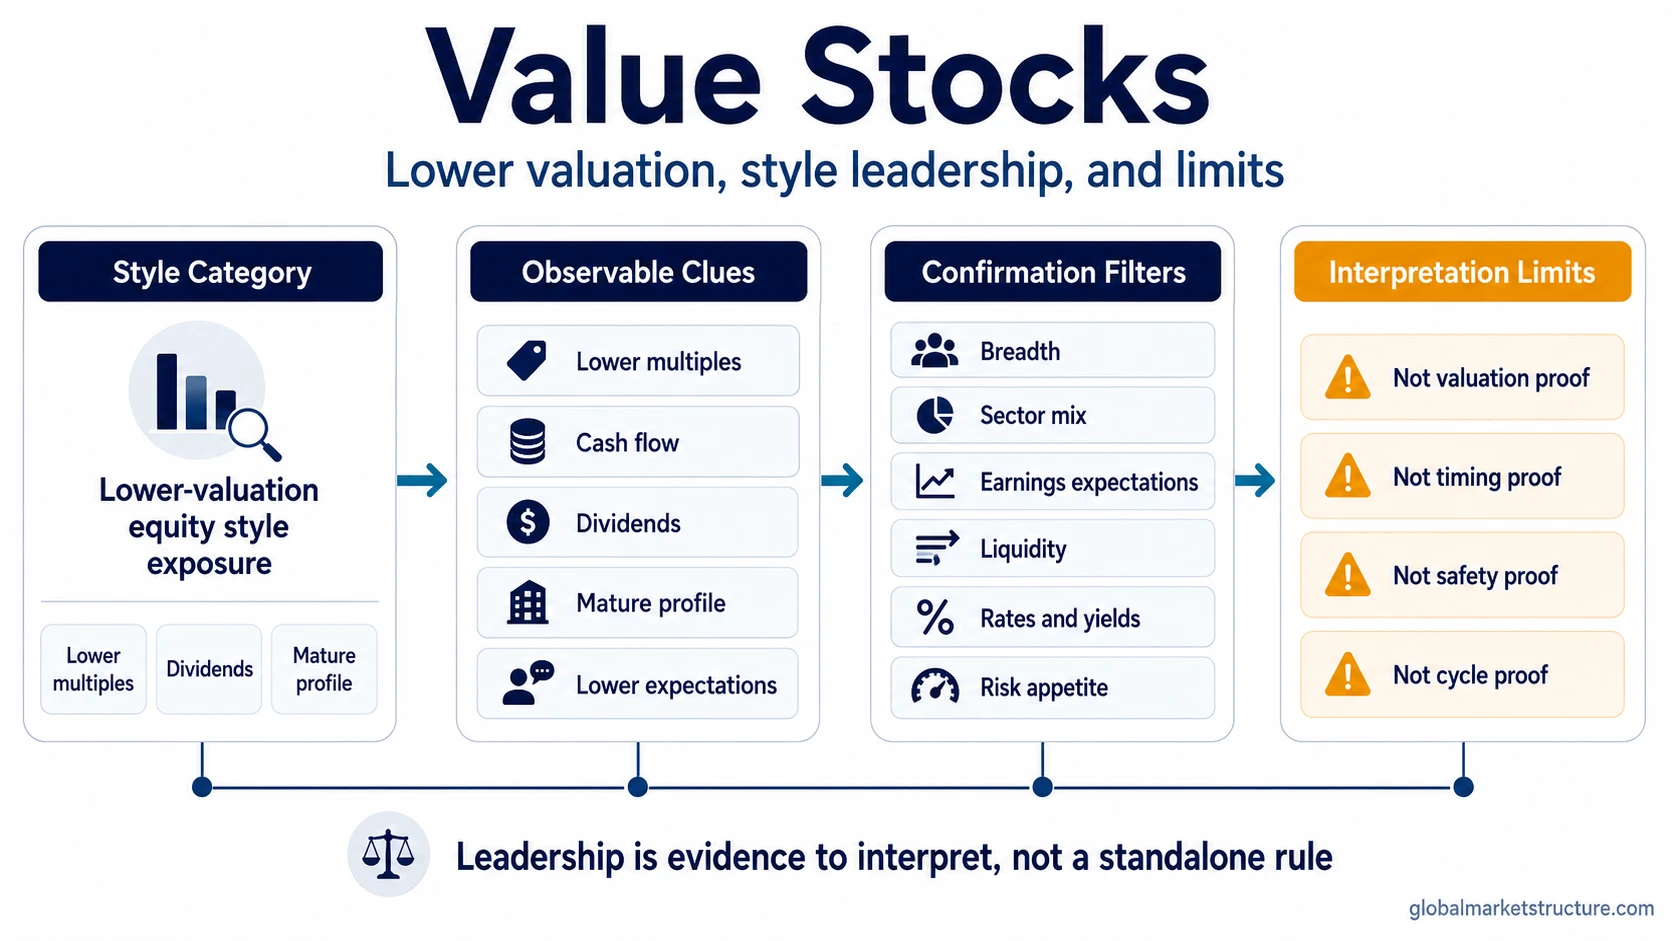
- Value leadership can appear during style rotation, but it needs confirmation from breadth, sector mix, earnings expectations, liquidity, and risk appetite.
- A cheap-looking stock can become a value trap when low valuation reflects weakening fundamentals rather than opportunity.
What Value Stocks Means
Definition: Value stocks are shares commonly priced at lower valuation multiples relative to fundamentals such as earnings, book value, cash flow, dividends, sales, assets, or market expectations.
The category describes how the market prices a company relative to its current or expected fundamentals. A stock may look like value because its price is low compared with earnings, book value, cash flow, sales, or dividends. That classification does not automatically mean the stock is attractive.
Value stocks are different from value investing as a strategy. Value investing is a broader investment process that tries to identify mispriced securities. Value stocks are a style category used to describe how a group of equities is being priced and how that group behaves relative to other market exposures.
What Can Make a Stock Look Like Value
A value stock often has one or more observable characteristics. These characteristics are classification clues, not a checklist for quality.
- Lower valuation multiples: price-to-earnings, price-to-book, price-to-sales, price-to-cash-flow, or dividend yield may look cheaper than the broader market or faster-growth peers.
- More mature business profile: the company may have slower growth expectations, a more established business model, or less speculative future expansion priced in.
- Dividend or cash-flow emphasis: some value stocks are associated with dividends or near-term cash flow, but dividends are not required for a stock to be classified as value.
- Sector concentration: value exposure can be concentrated in financials, energy, industrials, materials, utilities, consumer staples, or other groups depending on index construction and market conditions.
- Lower expectations: the market may already be discounting slower earnings growth, cyclical pressure, balance-sheet risk, or weaker sentiment.
Classification limit: One low metric is not enough to prove that a stock is value in a useful market-structure sense. A low P/E ratio, for example, may reflect depressed expectations, temporarily high earnings, cyclical risk, leverage, or a business that is deteriorating.
Value Stocks Inside Style Rotation
In style rotation, value stocks become more important when their relative behavior changes against growth stocks, quality stocks, defensive exposures, cyclical sectors, or the broader equity market. The useful question is not whether value is “cheap” in isolation. The useful question is whether value is gaining or losing leadership within the wider market structure.
Value leadership can appear when investors begin favoring nearer-term earnings, cash flow, dividends, asset value, or cyclical recovery potential over long-duration future growth. That preference can be influenced by rates and yields, liquidity conditions, inflation pressure, credit conditions, risk appetite, valuation spreads, and earnings expectations.
The interpretation becomes stronger when value strength is not isolated to one narrow pocket. Breadth matters. Sector mix matters. Earnings revisions matter. Credit and liquidity context matter. A value move led by one sector can mean something different from value strength that broadens across several groups.
Relative value strength can contribute to market leadership analysis, but leadership is evidence to interpret, not proof of a durable regime shift.
What Value Stocks Can Show vs What They Do Not Prove
| Observation | Can show | Does not prove |
|---|---|---|
| Low valuation | Market expectations are lower or fundamentals are priced cheaply. | The stock is undervalued, high quality, or attractive. |
| Relative outperformance | Value style may be gaining leadership against growth or broader equity exposure. | A durable market-cycle phase has started. |
| Dividend orientation | Investors may be favoring cash flow, income, or nearer-term fundamentals. | The stock is safe. |
| Sector concentration | Value leadership may be tied to financials, energy, industrials, defensives, or another sector group. | Broad value strength is present across the whole market. |
| Breadth confirmation | More value areas are participating in the move. | The move cannot reverse. |
| Rate and yield context | Discount-rate pressure may be changing style preference. | Rising rates automatically favor all value stocks. |
| Value trap risk | Cheapness may reflect deteriorating fundamentals or weaker expectations. | Low price equals opportunity. |
Cheap Stocks, Value Traps, and False Signals
Important limitation: Cheap valuation is not the same as undervaluation, quality, leadership, timing, safety, or a buy signal.
A value trap can appear when a stock looks cheap because the market is discounting weaker earnings, leverage, declining competitiveness, poor cash flow, cyclical pressure, or structural deterioration. In that situation, low valuation may be a warning about fundamentals rather than a hidden opportunity.
False readings often come from treating a single valuation metric as a complete answer. A low P/E ratio can look attractive, but the interpretation changes if earnings are falling, margins are under pressure, debt costs are rising, or the sector is being repriced for a weaker cycle.
The same logic applies to style leadership. Value outperforming growth may suggest a style shift, but that signal is weaker if participation is narrow, earnings expectations are deteriorating, credit conditions are worsening, or the move depends on one concentrated sector.
Practical Scenario
A market begins to show value outperforming growth while yields rise and liquidity becomes less supportive. That may suggest investors are reducing exposure to long-duration growth expectations and favoring nearer-term cash flows, dividends, cyclicals, or mature businesses. The interpretation remains incomplete unless breadth improves, sector participation broadens, earnings expectations confirm the move, and risk appetite supports the leadership shift.
The scenario treats value leadership as evidence, not as an instruction. A style move can start, stall, broaden, or reverse depending on the surrounding market structure.
Value Stocks vs Growth Stocks
Value stocks are usually priced lower relative to current fundamentals, assets, cash flow, dividends, or market expectations. Growth stocks are usually priced more around expected future revenue, earnings, market share, or business-scale expansion.
The contrast is useful because value and growth can respond differently to changes in rates, liquidity, risk appetite, valuation pressure, earnings expectations, and sector leadership. The distinction is not a ranking of which style is better. It is a way to separate how different parts of the equity market are being priced.
A broader growth vs value comparison can separate the two style categories in more detail, while value stocks remain one side of that broader style-rotation relationship.
Related Concepts
Value stocks connect most directly to growth stocks, growth vs value, and market leadership because style categories become more meaningful when their relative behavior changes inside a broader market environment.
- Growth stocks describe the neighboring style category usually tied to expected future expansion.
- Growth vs value separates the two style categories and their common market-cycle confusion points.
- Market leadership explains how relative strength can become broader evidence inside cycle and rotation analysis.