
Housing market indicators are data points used to read housing activity, construction momentum, affordability pressure, inventory, prices, sales, builder sentiment, and rate sensitivity. They work best as a grouped map, not as one forecast. A stronger macro reading compares permits, starts, completions, affordability, inventory, prices, sales activity, sentiment, and rate context before drawing a broader conclusion.
Key Points
- Building permits show upstream authorization, not completed construction.
- Housing starts show construction that has begun, not final supply delivery.
- Housing affordability connects income, home prices, and financing costs.
- Prices need context from inventory, sales volume, affordability, and construction activity.
- Builder sentiment is survey-based and should be compared with actual activity data.
- Rate context matters, but mortgage rates, bond yields, and real-rate pressure do not explain the whole housing cycle by themselves.
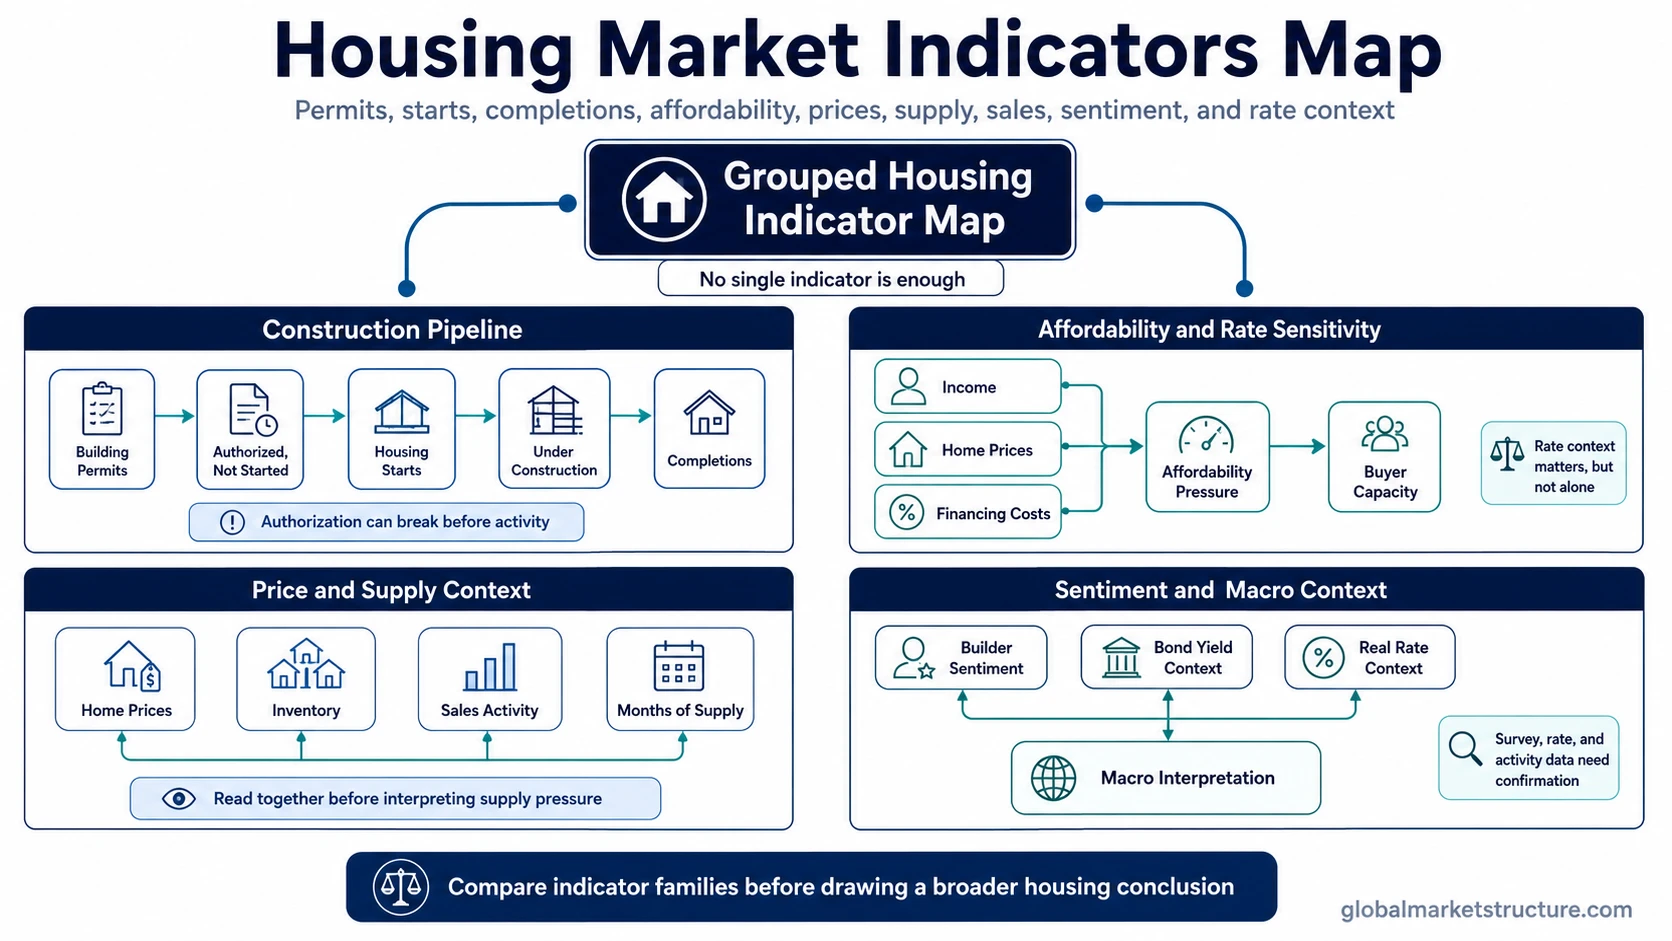
Main Housing Market Indicators
| Indicator family | What it measures | What it can reveal | What it cannot prove |
|---|---|---|---|
| Building permits | Authorization for future construction | Upstream builder intent and potential future supply | That construction will start or be completed |
| Housing starts | New residential construction that has begun | Actual construction activity | Final supply delivery or affordability conditions |
| Units under construction / completions | Active construction pipeline and finished units | Supply moving through the construction pipeline | Demand strength or price direction by itself |
| Housing affordability | Relationship between income, home prices, and financing costs | Demand pressure and buyer capacity | Immediate price movement |
| Home prices / house price indexes | Changes in home values or sale prices | Price pressure and valuation conditions | Full housing-market health without sales, inventory, and affordability |
| Inventory / homes for sale / months of supply | Available supply relative to demand | Supply tightness or supply buildup | Price direction without demand and rate context |
| Home sales / pending sales | Transaction activity and demand flow | Whether buyers are active | Construction pipeline strength |
| Housing market index / builder sentiment | Survey-based builder confidence, current sales, expected sales, and buyer traffic | Builder expectations and sentiment | Completed construction activity |
| Mortgage-rate / bond-yield / real-rate context | Financing pressure and rate sensitivity | Whether financing conditions are tightening or easing | The full housing cycle alone |
Which Indicator Answers Which Question?
| Reader question | Best indicator family | What it helps answer | Best next topic |
|---|---|---|---|
| Are builders receiving authorization to build? | Building permits | Upstream construction authorization and builder intent | Building permits |
| Has actual construction begun? | Housing starts | Current construction activity, not only authorization | Housing starts |
| Is housing becoming harder to afford? | Housing affordability | Whether income, home prices, and financing costs still support demand | Housing affordability |
| Are rates pressuring housing demand? | Mortgage-rate, real-rate, and bond-yield context | Whether financing conditions are tightening or easing for buyers and builders | Real interest rates and bond yields |
| Are prices rising or falling? | House price indexes and median sale prices | Price movement, not full housing health | Use with sales, inventory, affordability, and construction data before drawing a broader housing conclusion. |
| Is supply building or tightening? | Inventory, homes for sale, months of supply, and completions | Whether available supply is expanding, constrained, or regionally uneven | Use with completions, sales activity, affordability, and price data before treating supply as tight or loose. |
| Are builders confident? | Housing market indexes and builder sentiment | Survey-based sentiment and expected conditions | Use with permits, starts, completions, and sales data before treating sentiment as actual activity. |
| Are sales slowing or improving? | Existing sales, new sales, and pending sales | Demand and transaction activity | Use with inventory, affordability, prices, and construction data before treating sales as the full housing picture. |
Construction Pipeline: Permits, Starts, and Completions
The construction pipeline begins with authorization, but authorization does not guarantee a completed home.
Authorization has been issued for future construction.
The project is authorized, but construction has not yet begun.
Construction has begun, moving the project from authorization into actual activity.
The project remains inside the active construction pipeline.
Finished units reach the end of the construction pipeline.
Permits sit upstream. They can show that builders have received authorization to build, but financing, demand, labor, material costs, local rules, or project delays can still prevent authorization from becoming actual construction activity.
Starts are closer to real activity because construction has begun. They still do not prove that finished supply will arrive quickly or that housing has become affordable. Units under construction and completions help show whether supply is moving through the pipeline or getting delayed before delivery.
Seasonally adjusted annual rates describe the pace implied by the current monthly data. They should not be read as a prediction that the same pace must continue.
Affordability and Rate Sensitivity
Affordability is not only a home-price question. It combines home prices, household income, and financing costs. Depending on the index or data source, the details may also reflect mortgage qualification assumptions and other ownership-cost inputs.
Price data show what homes are selling for or how values are changing. Affordability asks whether household income and financing conditions can support those prices.
Measure price movement or home values.
Connects prices with income and financing costs to assess buyer capacity.
Rate sensitivity matters because housing often depends on long-term financing. When mortgage-rate pressure rises, the same home price can become harder to carry. When incomes rise, affordability pressure may ease even if home prices remain high. When prices rise faster than incomes, affordability can weaken before sales or construction data fully reflect the pressure.
Rate context should stay connected to the broader macro environment. Bond-yield pressure and real-rate pressure can affect financing conditions, but rates do not explain the housing cycle alone. Inventory, prices, income, credit conditions, builder costs, regional supply, and buyer demand can all change the interpretation.
Prices, Inventory, and Sales Are Different Signals
Prices, inventory, and sales describe different parts of the housing market. Reading them separately makes it easier to see whether a change is coming from price pressure, available supply, or transaction activity.
Show price pressure. A rise or decline does not describe full housing-market health without demand, supply, affordability, and transaction context.
Shows available supply. Rising inventory does not automatically mean falling prices, and low inventory does not automatically mean broad housing strength.
Show transaction activity and whether buyers are active. Sales do not describe the construction pipeline by themselves.
Housing Indexes and Builder Sentiment
Housing indexes and sentiment surveys can add useful context, but they should not be treated as completed activity. Builder sentiment can reflect current sales conditions, expected sales, and buyer traffic. That makes it useful for reading expectations and pressure inside the builder sector.
Sentiment can shift before hard activity data changes, but it can also move without immediate confirmation from permits, starts, completions, or sales. The cleaner interpretation compares sentiment with actual construction and transaction data.
Common False Readings
| False reading | Safer interpretation |
|---|---|
| Permits prove future construction. | Permits are upstream authorizations. They become more useful when compared with starts, under-construction units, completions, and affordability. |
| Starts fully describe housing strength. | Starts show construction activity, but not final supply delivery, demand strength, or affordability. |
| Home prices are enough to diagnose housing health. | Prices should be read with inventory, sales volume, affordability, and construction indicators. |
| Mortgage rates explain the full housing cycle. | Rates are a major transmission channel, but income, prices, inventory, credit, builder costs, and regional supply also matter. |
| Builder sentiment proves future construction. | Sentiment is survey-based. Actual activity still needs confirmation from permits, starts, completions, and sales. |
| Housing weakness is automatically a recession signal. | Housing can be rate-sensitive and macro-relevant, but housing indicators are not a deterministic recession model. |
| Housing data creates a market signal. | Housing data can inform macro context, but it is not a buy or sell signal and does not provide portfolio instructions. |
A Simple Mixed-Signal Scenario
A mixed housing setup can appear when permits remain firm, starts slow, affordability weakens, prices stay sticky, and inventory begins to rise. That combination does not produce one automatic conclusion.
Permits remain firm while housing starts slow.
Affordability weakens, prices remain sticky, and inventory begins to rise.
Separate authorization, actual construction, buyer capacity, prices, available supply, sales, and rate conditions before drawing a macro conclusion.
Permits may still show builder intent. Starts may show that actual construction is less responsive. Affordability may show pressure on buyer capacity. Sticky prices may reflect limited supply or delayed price adjustment. Rising inventory may show supply building, weaker demand, or both.
The macro interpretation becomes stronger only when several indicator families point in the same direction. When they conflict, the safer reading is to separate authorization, construction activity, affordability, prices, supply, sales, and rate context instead of forcing one headline conclusion.
More Specific Housing Questions
Move from the broad indicator map to the specific housing signal that matches the question:
Use when the question is about upstream construction authorization.
Use when the question is about actual construction activity.
Use when the question is about buyer capacity, income, prices, and financing costs.
Use real interest rate and bond yields when the question is about financing pressure and rate sensitivity.
Housing indicators are most useful when they organize the macro question. They become weaker when one number is treated as a forecast, a recession model, a homebuying answer, or a trading signal.
Sources and Methodology Notes
Census New Residential Construction data separate the housing pipeline into authorization, starts, units under construction, and completions. Census methodology also cautions that an annualized monthly pace should not be read as a forecast that the same pace must continue.
The FHFA House Price Index is relevant when house price indexes are discussed as price-change measures for single-family homes.
The NAHB/Wells Fargo Housing Market Index is a survey-based builder sentiment measure built around current sales, expected sales, and prospective buyer traffic.
NAR housing affordability methodology connects typical family income, the median-priced existing single-family home, and prevailing mortgage-rate assumptions.
FAQ
What are housing market indicators?
Housing market indicators are data points that help read housing activity, construction momentum, affordability, inventory, prices, sales, sentiment, and rate sensitivity. They should be compared as a group because no single housing indicator captures the full housing cycle.
What is the difference between building permits and housing starts?
Building permits show authorization for future construction. Housing starts show that construction has actually begun. The gap matters because authorization can fail to become activity when financing, demand, labor, materials, or delays interfere.
Which housing indicator shows affordability pressure?
Housing affordability indicators are the most direct fit because they connect income, home prices, and financing costs. Affordability should still be read with sales, inventory, prices, and rate context.
Do housing market indicators predict recessions?
Housing indicators can help show rate sensitivity and cyclical pressure, but they should not be treated as a deterministic recession model. A stronger macro reading compares housing with credit, labor, income, consumption, inflation, rates, and broader activity data.
Can housing indicators be used as trading signals?
Housing indicators can inform macro context, but they are not buy or sell signals. They do not provide market timing, portfolio allocation, homebuying advice, or investment instructions.