
Market sentiment is the broad mood of market participants, usually seen through optimism, pessimism, risk appetite, or risk aversion. It can help explain market pressure, but it is not a standalone forecast, reversal timer, or buy/sell signal.
Direct definition: Market sentiment describes how confident, cautious, optimistic, pessimistic, fearful, or greedy market participants appear to be toward a market, asset class, or broader risk environment.
Basic classification: Sentiment is often described as bullish, bearish, neutral, or extreme. Those labels describe pressure and participation context. They do not prove what markets will do next.
Key Points
- Market sentiment shows broad mood, not confirmed future direction.
- Bullish sentiment usually points to optimism or risk appetite, while bearish sentiment usually points to caution, pessimism, or risk aversion.
- Neutral sentiment can mean balanced views, mixed inputs, or a market waiting for confirmation.
- Extreme sentiment can matter, but extreme fear does not automatically mark a bottom and extreme greed does not automatically mark a top.
- Sentiment becomes more useful when checked against positioning, capital flows, breadth, volatility, and price structure.
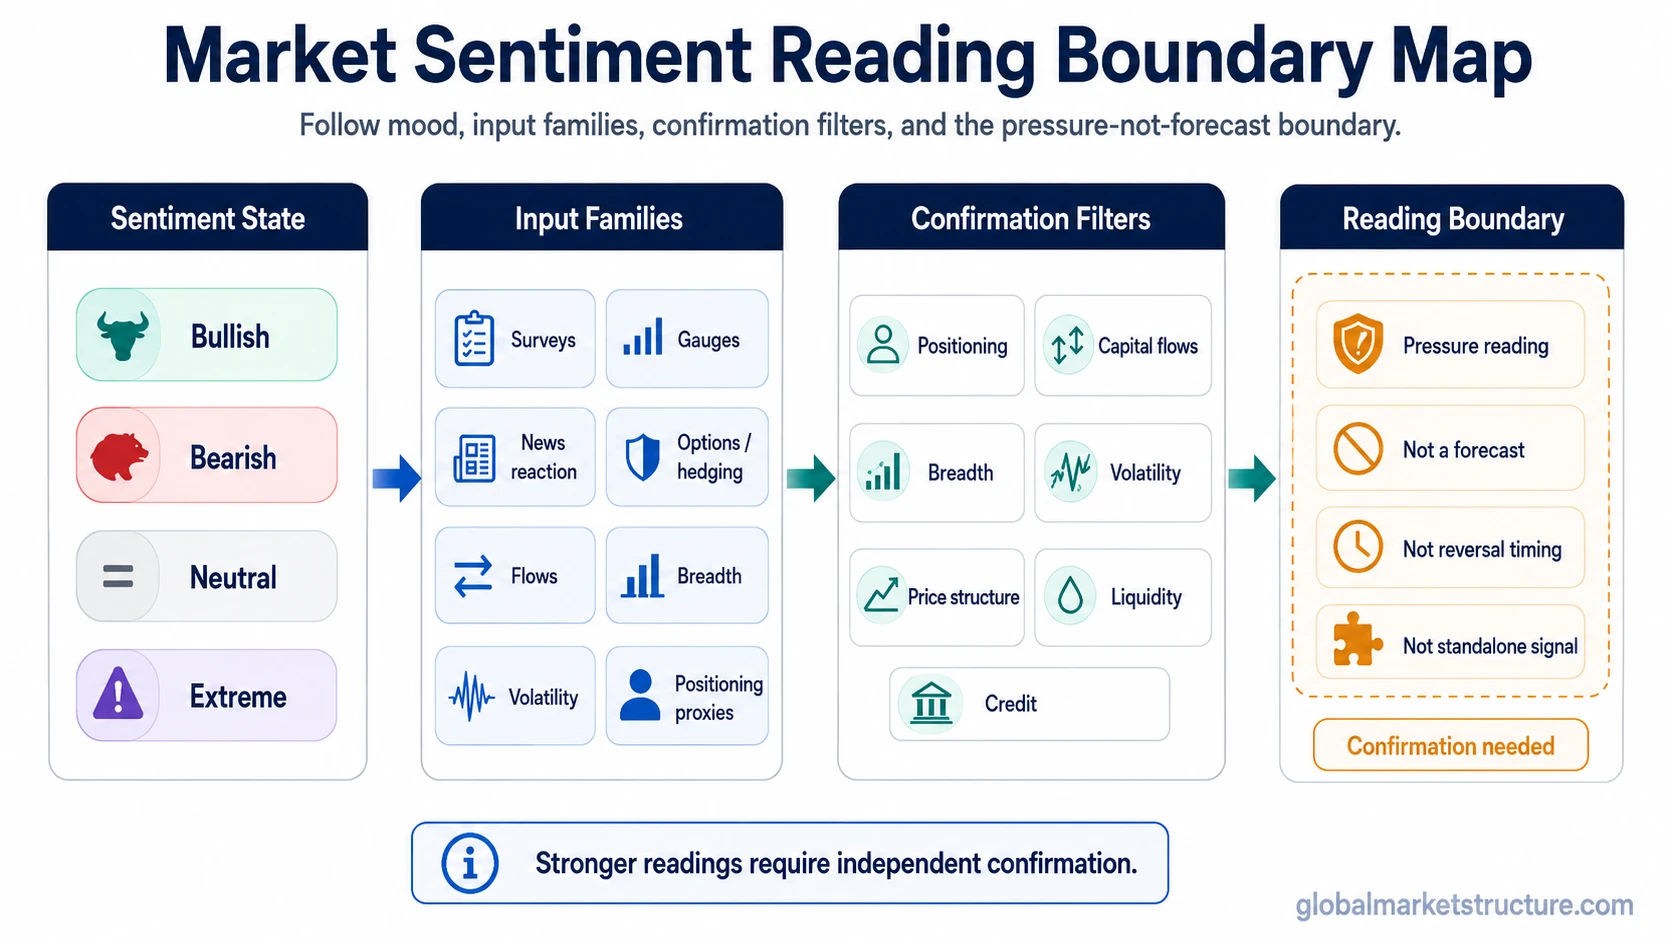
What Market Sentiment Shows
Market sentiment describes the tone of participation around risk. When investors and traders are more willing to own risk assets, accept volatility, and respond positively to news, sentiment is usually described as bullish or risk-on. When participants become more defensive, reduce exposure, hedge more aggressively, or react negatively to uncertainty, sentiment is usually described as bearish or risk-off.
In broad market-structure analysis, sentiment is best treated as a context layer. It helps describe whether the market environment is being shaped by optimism, caution, crowding, fear, greed, or hesitation. It should be read beside liquidity, credit, breadth, volatility, positioning, and capital-flow behavior rather than used alone.
Bullish, Bearish, Neutral, and Extreme Sentiment
| Sentiment state | What it may show | What it cannot prove |
|---|---|---|
| Bullish sentiment | Optimism, risk appetite, stronger confidence, or willingness to hold risk exposure. | It does not prove that prices must keep rising. |
| Bearish sentiment | Pessimism, risk aversion, caution, hedging demand, or reduced confidence. | It does not prove that prices must keep falling. |
| Neutral sentiment | Balanced mood, mixed signals, uncertainty, or lack of strong directional conviction. | It does not prove that risk is absent or that a major move is imminent. |
| Extreme sentiment | One-sided fear, greed, optimism, pessimism, or crowded emotional pressure. | It does not time reversals by itself. |
How Sentiment Shows Up in Markets
Sentiment can appear through several market inputs. Price reactions may become stronger after good or bad news. Flows may move toward or away from risk assets. Positioning may become more aggressive or more defensive. Hedging demand may rise when participants become worried. Breadth may improve when confidence spreads across more markets, or weaken when participation narrows.
Volatility can also help frame sentiment, but it should not be read mechanically. Lower volatility may reflect calm confidence, but it may also reflect complacency. Higher volatility may reflect fear, uncertainty, forced adjustment, or a repricing of risk. The stronger interpretation comes from checking whether sentiment is confirmed by other market-structure inputs or contradicted by them.
| Input family | Sentiment clue | Context check |
|---|---|---|
| Price behavior | Strong or weak reaction to news, support, resistance, or macro data. | Check whether the move is broad, persistent, and supported by structure. |
| Capital flows | Money moving toward or away from risk assets, sectors, regions, or defensive areas. | Check whether flows persist or reverse quickly. |
| Positioning | Exposure may become aggressive, defensive, or one-sided. | Check whether exposure is crowded enough to create pressure if conditions change. |
| Breadth | Participation may broaden during stronger risk appetite or narrow during fragile sentiment. | Check whether leadership is distributed or concentrated. |
| Volatility and hedging | Fear, uncertainty, complacency, or demand for protection may appear. | Check whether volatility confirms stress or only reflects short-term adjustment. |
Sentiment Versus Positioning, Flows, Crowding, and Forecasts
Sentiment is often confused with nearby concepts because they can move together. A market can feel optimistic while positioning is not yet crowded. A market can show bearish headlines while capital continues to flow into risk assets. A market can have strong sentiment but weak breadth. These differences matter because sentiment describes mood, while other inputs describe exposure, money movement, participation, or expectations.
| Concept | What it describes | How to use it with sentiment |
|---|---|---|
| Sentiment | Mood, confidence, fear, greed, optimism, pessimism, risk appetite, or risk aversion. | Use it to understand pressure and tone, not as a complete market model. |
| Positioning | Actual exposure held by investors, traders, funds, or other market participants. | Compare mood with exposure to see whether sentiment is already reflected in positions. |
| Capital flows | The movement of money into or out of asset classes, sectors, regions, or strategies. | Use flows to test whether sentiment is being confirmed by real allocation behavior. |
| Crowding | One-sided participation where many participants may be exposed to the same idea. | Use crowding to judge whether a sentiment reading may create vulnerability if conditions shift. |
| Forecast | An expected future outcome. | Do not treat sentiment alone as a forecast. It needs confirmation from broader evidence. |
Why Market Sentiment Can Mislead
Market sentiment can mislead when it is treated as a prediction instead of a pressure reading. A fearful market can become more fearful before conditions stabilize. A greedy market can remain strong for longer than expected if liquidity, breadth, and flows still support risk appetite.
Extreme fear does not automatically mean a market bottom. Extreme greed does not automatically mean a market top. The interpretation improves only when sentiment is compared with persistence, positioning pressure, flow behavior, breadth, volatility, and price structure.
- Survey limitation: surveys measure reported mood from a sample, not the entire market.
- Gauge limitation: fear and greed gauges combine selected inputs, but they are not complete market models.
- Contrarian limitation: extreme readings may create contrarian context, but they do not time a reversal by themselves.
- Timing limitation: sentiment can stay one-sided while markets continue in the same direction.
Illustrative Scenario: Optimism, Crowding, and Confirmation
Imagine a market where sentiment becomes very optimistic. News reactions are positive, volatility is low, and many participants describe the environment as risk-on. That optimism is useful information, but it is still only one layer.
The reading becomes more fragile if positioning is already crowded, capital-flow persistence starts weakening, breadth narrows, and volatility begins rising from a low base. The point is not that optimism predicts a top. The point is that sentiment becomes more useful when it is checked against exposure, flows, participation, volatility, and price structure.
How to Read Sentiment Without Turning It Into a Signal
A safer market-structure reading starts with the sentiment label, then asks what confirms or weakens it. Bullish sentiment is stronger when it is supported by broad participation, persistent inflows, constructive credit conditions, and stable volatility. Bearish sentiment is more meaningful when it appears beside defensive flows, weaker breadth, higher hedging demand, and stress across related markets.
The same sentiment label can mean different things in different regimes. Optimism during improving liquidity can reflect expanding risk appetite. Optimism during narrow leadership and crowded positioning may reflect vulnerability. Fear during a liquidity shock can show stress, while fear after broad deleveraging may show pressure that is already more visible. The label matters less than the surrounding confirmation.
Related Market Sentiment Concepts
For gauge-specific interpretation, use the Fear and Greed Index as a separate sentiment input rather than a complete forecast model.
For broader measurement families, investor sentiment indicators cover surveys, gauges, options behavior, positioning proxies, and related sentiment inputs.
For survey-specific context, the AAII Sentiment Survey belongs in its own route because it is one survey input, not the same as total market sentiment.
For one-sided participation, crowded trade explains how exposure can become concentrated around a shared market view.
For extreme-reading misuse, sentiment extremes and tops separates contrarian context from automatic reversal timing.
For multi-input interpretation, a positioning dashboard framework can help separate sentiment, exposure, flows, and crowding without treating any single input as a complete model.
FAQ
Is market sentiment a forecast?
No. Market sentiment describes market mood and pressure. It can help interpret risk appetite or risk aversion, but it does not forecast future price direction by itself.
Is market sentiment the same as positioning?
No. Sentiment describes mood or attitude. Positioning describes actual exposure. The two can align, but they can also diverge.
Can extreme sentiment time market reversals?
Extreme sentiment can provide contrarian context, but it does not time reversals on its own. Confirmation from flows, positioning, breadth, volatility, and price structure is still needed.
What indicators are related to market sentiment?
Related inputs can include sentiment surveys, fear and greed gauges, options activity, hedging demand, fund flows, positioning proxies, breadth, volatility, and news reaction. Each input is partial, so the interpretation is stronger when several independent inputs align.