
A positioning dashboard organizes several evidence families without forcing them into one universal signal. Surveys can describe stated expectations, options and volatility can show market-implied pressure, breadth can show participation, and positioning or flow data can show actual exposure. The framework becomes useful when those inputs are kept separate first and compared only after their source, horizon, and analytical role are clear.
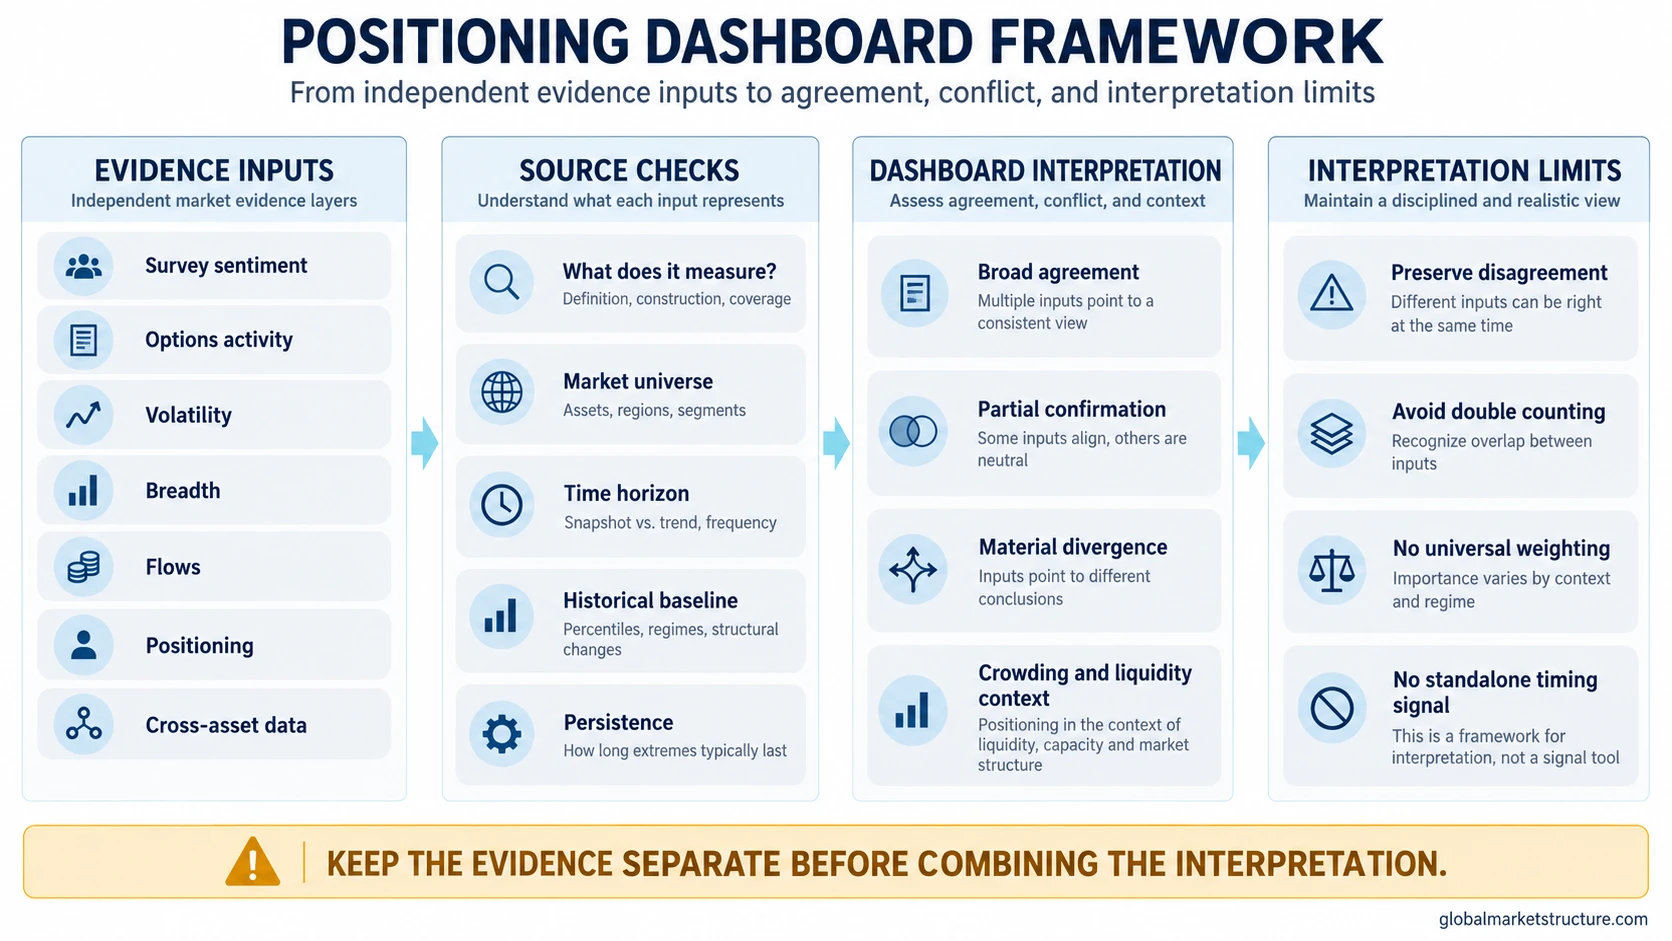
Different Inputs Measure Different Parts of the Market
Market sentiment is one layer of the dashboard. The full framework also needs evidence about actual exposure, participation, stress, liquidity, and the behavior of related markets.
The AAII Sentiment Survey records individual investors’ six-month market expectations. The Cboe VIX Index reflects market expectations of near-term volatility conveyed by S&P 500 option prices. The CFTC Commitments of Traders reports provide categorized open-interest data. These inputs can all contribute to market context, but they do not measure the same thing.
Dashboard Framework vs Composite Score
A composite score converts several inputs onto a common scale and applies a weighting method. A dashboard framework can keep the original evidence families visible, which makes it easier to see when sentiment, positioning, breadth, volatility, or flows disagree.
Multiple inputs are normalized and combined under a specific weighting methodology. The headline result is easy to compare, but interpretation depends on the formula and the information retained beneath the score.
Evidence families remain visible separately. Agreement can strengthen a reading, while disagreement stays available as information rather than being automatically averaged away.
Evidence Families in the Dashboard
| Evidence family | Primary observation | Dashboard question | Related route |
|---|---|---|---|
| Survey mood | What a surveyed group says about its expectations or risk attitude. | Is the reading persistent, unusual relative to its own history, and consistent with other evidence? | Use as mood input |
| Options activity | Observed options activity and demand across puts, calls, volatility structures, or related measures. | Does the activity reflect a broader shift in risk behavior, or could it be narrow hedging, event activity, or another options-specific effect? | Put-call ratio context |
| Volatility and stress | Market pricing or realization of uncertainty and stress. | Is volatility moving with broader risk conditions, or is the change isolated from the rest of the dashboard? | Use as stress input |
| Breadth and participation | How widely a market move is shared across securities or segments. | Is the headline move supported by broad participation or becoming dependent on narrower leadership? | Use as participation input |
| Flows and positioning | How participants are allocating capital or carrying exposure. | Does actual exposure confirm the stated or inferred sentiment condition? | COT report context |
| Crowding and liquidity | Whether similar exposure is becoming concentrated relative to the market’s ability to absorb exits or reallocations. | Would a change in positioning be absorbed normally, or could concentrated exposure become more fragile? | Crowded trade context |
| Cross-asset confirmation | Whether rates, credit, currencies, commodities, and other risk-sensitive markets show a compatible environment. | Does the broader market structure support the same interpretation or introduce a meaningful contradiction? | Use as confirmation input |
Reading Agreement and Conflict
| Dashboard state | Interpretation | Next observation |
|---|---|---|
| Broad agreement | Several independent evidence families describe a similar risk environment. | Check whether the agreement persists and whether the underlying inputs continue to behave consistently. |
| Partial agreement | Some inputs confirm the interpretation while others remain neutral or ambiguous. | Identify which evidence family is lagging and whether its difference is material to the market question being studied. |
| Material divergence | Important evidence families point in different directions. | Reduce confidence in the headline interpretation and preserve the disagreement until subsequent evidence resolves it. |
Positioning Dashboard Sequence
Label the source, evidence family, market universe, and time horizon before interpreting the reading.
Compare the observation with the history and methodology of the same series rather than applying one threshold across unrelated indicators.
Separate a brief move from a condition that remains visible across several observations.
Look for agreement, partial confirmation, or meaningful divergence across sentiment, exposure, participation, volatility, liquidity, and cross-asset behavior.
Record the evidence that would reduce confidence, resolve a divergence, or show that the original reading was too narrow.
Failure Mode: Strong Mood With Weak Confirmation
Positive survey or sentiment readings are accompanied by broad participation, stable volatility, constructive flows, and supportive liquidity.
Mood remains optimistic while breadth narrows, flows become concentrated, positioning becomes more crowded, or liquidity conditions become less supportive.
The dashboard becomes mixed rather than uniformly positive. The divergence is evidence to monitor, not an automatic reversal call.
Contrarian investing becomes more relevant when a stretched sentiment condition is joined by evidence that the surrounding structure is becoming less supportive. Sentiment alone does not establish that transition.
Framework Limits
Current survey values, volatility measures, options statistics, positioning reports, flow data, breadth measures, and cross-asset prices still belong with their direct providers or original data sources. Different evidence families can disagree for legitimate reasons. When they do, the disagreement should remain visible until additional observations provide a clearer interpretation.
Where the Framework Fits
This Strategy page sits above the individual indicators and evidence pages in the broader positioning and sentiment cluster. The Entity and Support pages explain specific measures or concepts. This framework provides the sequence for combining them without collapsing their different analytical roles.