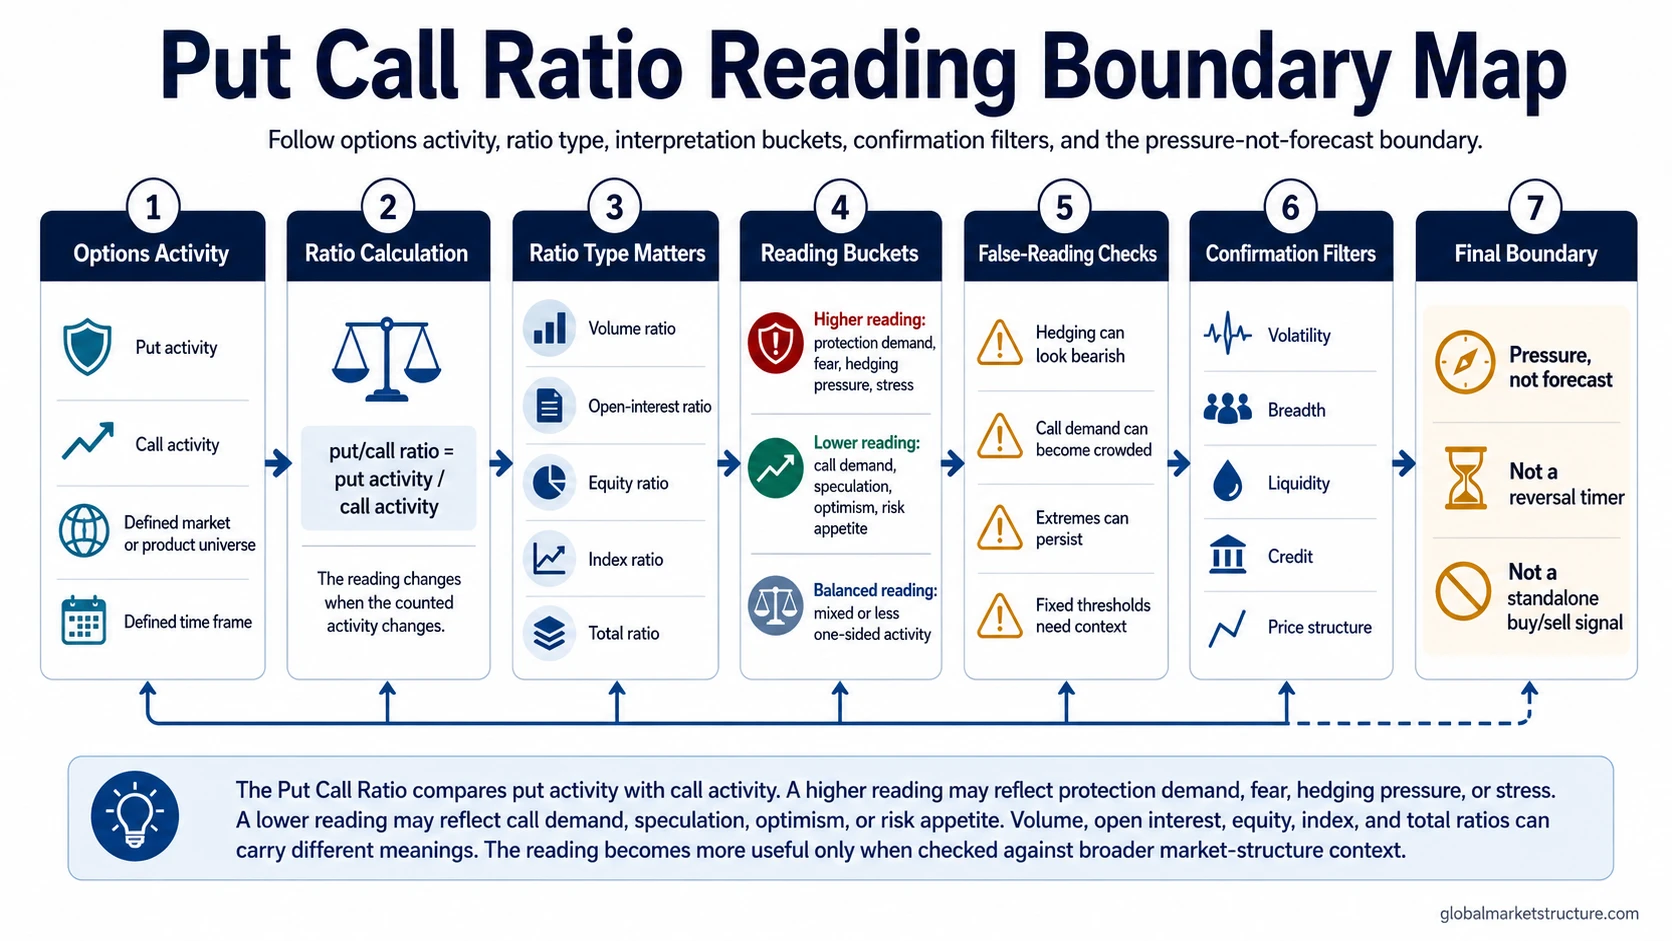
Put Call Ratio measures put option activity relative to call option activity, usually using the formula put/call ratio = put activity / call activity for a defined market, product group, and time period. It is an options sentiment and positioning-pressure input: high readings can reflect protection demand or fear, while low readings can reflect call demand or speculation. It is not a forecast, reversal timer, or standalone trading signal.
Definition: Put Call Ratio is the ratio of put option activity to call option activity. The basic formula is put/call ratio = put activity / call activity. The meaning depends on what activity is counted, which option universe is included, and which time frame is being measured.
For market sentiment, the ratio helps identify whether options activity is leaning toward defensive protection, speculative demand, or a more balanced positioning backdrop. The reading becomes more useful when it is interpreted as pressure inside the positioning system, not as a direct prediction about the next market move.
Key Points
- Put Call Ratio compares put activity with call activity for a defined market, index, product group, or data universe.
- A higher reading can reflect protection demand, hedging pressure, fear, or stress, but it can also reflect portfolio insurance rather than pure bearish speculation.
- A lower reading can reflect stronger call demand, optimism, speculation, or risk appetite, but it does not automatically identify complacency or a market top.
- Volume-based and open-interest-based ratios answer different questions and should not be treated as interchangeable.
- The ratio needs confirmation from volatility, breadth, liquidity, credit, and price structure before it becomes useful for broader market interpretation.
How Put Call Ratio Is Calculated
The basic calculation divides put activity by call activity. If a market has 900,000 puts and 600,000 calls in the chosen data set, the ratio is 1.5. If it has 400,000 puts and 800,000 calls, the ratio is 0.5.
The calculation is simple, but the interpretation is not. A ratio based on total market option volume can carry a different message from a ratio based only on equity options, index options, weekly options, or open interest. The same number can also mean different things when compared with different historical baselines.
Current values should be checked through direct data providers or exchange-style endpoints. A conceptual explanation can define the ratio and the interpretation rules, but live values require dated source data.
What the Ratio Measures
Put options often increase when investors want downside protection, hedge existing exposure, or express concern about market stress. Call options often increase when investors seek upside exposure, express optimism, or pursue speculative participation. Put Call Ratio compresses that balance into one observable reading.
The useful distinction is between activity and intent. The ratio can show that put or call activity is rising, but it cannot always identify why the activity is rising. A large put flow may be defensive hedging, outright bearish speculation, volatility positioning, or part of a spread. A large call flow may be optimistic speculation, hedging by another participant, or part of a larger options structure.
That is why the ratio belongs inside a broader positioning framework. It can support interpretation, but it should not replace context from price behavior, volatility, breadth, liquidity, and credit conditions.
Put Call Ratio Types
Ratio type matters before interpretation. A volume ratio focuses on current trading activity, while an open-interest ratio focuses on outstanding contracts. Equity, index, and total ratios also capture different behavior because single-stock options and index options are often used for different purposes.
| Ratio type | What it measures | Useful for | Main limitation |
|---|---|---|---|
| Volume put/call ratio | Put volume divided by call volume over a defined period. | Reading current options activity and short-term positioning pressure. | Can be noisy because daily option flow may reflect hedges, spreads, or short-lived positioning. |
| Open-interest put/call ratio | Outstanding put contracts divided by outstanding call contracts. | Assessing existing option positioning rather than only current trading activity. | Does not show when positions were opened or whether they still express the original intent. |
| Equity put/call ratio | Put and call activity in single-stock options. | Reading sentiment and speculation in individual equity options activity. | Can be influenced by stock-specific events, earnings, and speculative call demand. |
| Index put/call ratio | Put and call activity in index options. | Reading portfolio hedging, index protection demand, and broader market risk management. | Can reflect institutional hedging rather than a simple directional market opinion. |
| Total put/call ratio | Combined put and call activity across a broader options universe. | Getting a broad options sentiment snapshot. | Can blur important differences between equity speculation and index hedging. |
How High and Low Readings Are Interpreted
A high Put Call Ratio means put activity is elevated relative to call activity in the chosen universe. That can suggest fear, protection demand, defensive hedging, stress, or a more cautious positioning backdrop. It can also appear when investors are protecting portfolios while still holding risk exposure.
A low Put Call Ratio means call activity is elevated relative to put activity. That can suggest optimism, speculative appetite, risk-seeking behavior, or lower demand for protection. It can also reflect a period when investors are using calls to express upside participation rather than directly buying underlying assets.
Neither reading is automatically bullish or bearish. Extreme readings can persist, and fixed thresholds can mislead when the market universe, option product mix, volatility regime, or historical baseline changes.
What Put Call Ratio Can Show and Cannot Show
Can show: options-derived pressure, relative put demand, relative call demand, defensive hedging behavior, speculative appetite, and possible crowding in one side of the options market.
Cannot show: guaranteed direction, exact reversal timing, market tops or bottoms by itself, the reason behind every option transaction, or a complete view of investor sentiment.
The ratio becomes more useful when it is compared with its own history and confirmed by other market-structure inputs. A high ratio during widening credit spreads, weaker breadth, rising volatility, and deteriorating price structure carries a different interpretation from a high ratio during calm credit conditions and stable participation.
The same logic applies to low readings. Strong call demand can be a sign of risk appetite, but it can also become a crowded trade risk if positioning becomes one-sided and broader confirmation weakens.
Put Call Ratio and Contrarian Interpretation
Put Call Ratio is often discussed as a contrarian signal because very high put activity can appear near periods of heavy fear, while very low put activity can appear during periods of strong optimism. The safer interpretation is conditional: the ratio can identify pressure or crowding, but it does not prove that the pressure is about to reverse.
Contrarian use becomes stronger when the reading is extreme versus its own history, persists long enough to show meaningful positioning pressure, and then aligns with broader evidence. Without that confirmation, the ratio may only show that participants are hedging, speculating, or reacting to volatility.
Options positioning also differs from futures positioning. The Commitments of Traders report focuses on futures-market positioning by participant category, while Put Call Ratio focuses on the balance of put and call activity inside an options universe. Both can inform positioning analysis, but they answer different questions.
Practical Scenario
A market can show a rising Put Call Ratio while the index price remains broadly stable. One explanation is that investors are buying protection while still holding equity exposure. That can indicate rising defensive demand, but it does not prove an immediate selloff or reversal.
The interpretation becomes stronger if the same period also shows weakening market breadth, higher volatility, tighter liquidity, wider credit spreads, or price structure that fails to confirm the stable index level. Without those checks, the ratio is only one pressure reading.
Common Mistakes
Using fixed thresholds as universal rules: A level that looks extreme in one option universe or volatility regime may be normal in another.
Reading high put activity as automatic reversal fuel: High put demand can reflect hedging, stress, or protection, not only excessive bearish speculation.
Reading low put activity as automatic danger: Heavy call demand can reflect optimism or speculation, but it does not identify a top without broader evidence.
Ignoring the data universe: Equity, index, total, volume, and open-interest ratios can carry different messages.
Treating the ratio as a complete sentiment model: Put Call Ratio is one options-derived input, not the full sentiment, positioning, or market-regime picture.
Where Put Call Ratio Fits in Market Structure
Put Call Ratio fits best as a positioning and sentiment input. It helps classify whether options activity is leaning toward protection demand, speculative appetite, or one-sided pressure. It becomes more useful when combined with volatility, market breadth, liquidity conditions, credit signals, and price structure.
The ratio is weaker when it is isolated from context. A single high or low reading can be useful as a prompt for further analysis, but the market-structure question is whether other evidence confirms the same pressure or contradicts it.
FAQ
Is the Put Call Ratio bullish or bearish?
It is not automatically bullish or bearish. A high reading can reflect protection demand or fear, while a low reading can reflect call demand or speculation. The meaning depends on the data universe, historical baseline, and broader market context.
Can the Put Call Ratio predict market reversals?
No. It can identify options-derived sentiment or positioning pressure, but it cannot time reversals or identify market tops and bottoms by itself.
What is the Put Call Ratio formula?
The basic formula is put/call ratio = put activity / call activity. The activity can be measured by volume, open interest, or another defined options data set.
Why can high put activity reflect hedging instead of bearish speculation?
Investors may buy puts to protect existing portfolios rather than to express a direct bearish view. That is why index put activity can rise even when investors have not fully reduced risk exposure.