
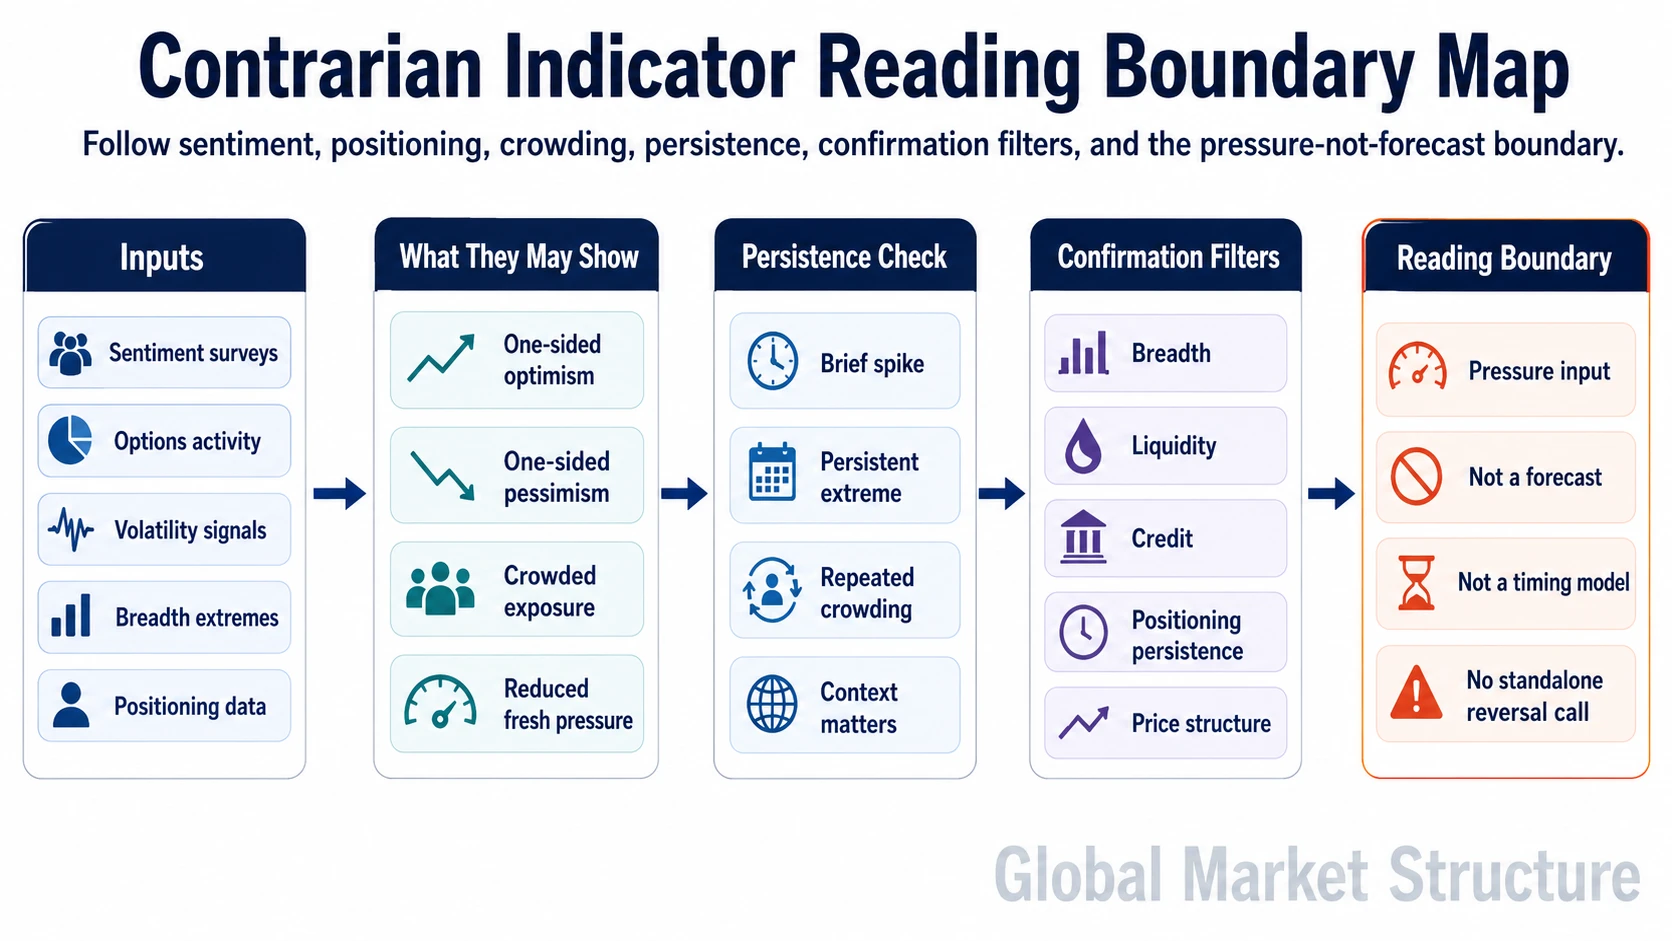
A contrarian indicator is a sentiment, positioning, or crowding input used to identify when market consensus may have become unusually one-sided. An extreme can show pressure or vulnerability, while the timing and direction of any market response still depend on what happens in positioning, breadth, liquidity, credit, and price structure.
What a Contrarian Reading Measures
Contrarian analysis starts with an imbalance. Investors may report unusually strong optimism or pessimism, options activity may become heavily tilted, or actual exposure may become concentrated on one side of the market.
Those observations do not carry the same information. A survey measures stated sentiment. Positioning data describes actual exposure more directly. Options activity can reflect speculation, hedging, or portfolio construction. Reading them as interchangeable can create false confidence.
| Input | Primary information | Reading boundary |
|---|---|---|
| Sentiment survey | How respondents describe their outlook or expectations. | Stated views can remain extreme while price and positioning continue in the same direction. |
| Put-call ratio | The balance between put and call activity within a defined options universe. | The ratio alone does not identify how much of the activity comes from directional speculation, hedging, or other portfolio structures. |
| Volatility measures | The amount of uncertainty or volatility being priced or realized. | Elevated volatility can persist while market stress is still developing. |
| Market breadth | How widely participation is distributed across securities or market segments. | An extreme breadth reading needs to be interpreted relative to the price trend and subsequent participation. |
| Positioning data | How heavily participants are exposed to one side, asset, theme, or market. | Concentrated exposure can remain in place until the conditions supporting the position begin to change. |
Extreme Conditions and Confirmed Change
Sentiment or positioning can remain one-sided for an extended period. A stronger contrarian reading develops when the surrounding market structure begins to change as well.
Sentiment, positioning, options activity, volatility, or breadth has moved toward an unusually one-sided condition relative to the measure being used.
Breadth, liquidity, credit, positioning behavior, or price structure begins to move in a way that is consistent with the one-sided condition losing support.
Why Positioning Changes the Interpretation
Sentiment becomes more informative when it can be compared with actual exposure. Strong optimism with light positioning describes a different market from strong optimism with heavy positioning. The same distinction applies to pessimism.
When a view is already widely expressed through positions, future price behavior can become more sensitive to changes in the conditions supporting those positions. A crowded trade is relevant for that reason: concentration can change the flow response if participants later need to reduce similar exposures at the same time.
Persistence also carries information. A short-lived sentiment spike and an extreme that remains in place while market internals begin to change should not be treated as equivalent observations.
How to Read a Contrarian Signal
Identify the source, market universe, calculation method, observation date, and historical comparison used to classify the reading as extreme.
Separate a temporary spike from a condition that has remained stretched across several observations.
Look for evidence that the expressed view is also reflected in positioning, flows, options activity, or other measures of actual market participation.
Evaluate whether breadth, liquidity, credit conditions, positioning behavior, and price structure are beginning to confirm that the extreme is affecting the market differently.
When the Contrarian Reading Remains Incomplete
Bearish sentiment can remain elevated while liquidity, credit, breadth, or price structure continue to deteriorate. Optimism can remain elevated while flows, participation, and price structure continue to support higher prices. The extreme identifies a condition to monitor; the surrounding evidence determines whether that condition has begun to alter the market structure.
Contrarian Indicator vs Related Concepts
| Concept | Primary job | Boundary |
|---|---|---|
| Market sentiment | Describes the prevailing mood, expectations, or risk attitude of market participants. | A contrarian indicator interprets an unusually stretched reading rather than simply describing the prevailing mood. |
| Positioning | Describes the actual exposure or allocation held by market participants. | Positioning can provide the exposure context behind a contrarian reading without being a contrarian signal by itself. |
| Crowded trade | Describes a position or theme held by many participants in a similar form. | Crowding can make one-sided exposure more relevant to contrarian analysis, but it does not establish reversal timing. |
| Contrarian investing | A broader investment approach built around taking views that differ from prevailing consensus. | A contrarian indicator is a measurement or interpretation input rather than a complete investment philosophy. |
Where the Reading Fits
A contrarian indicator is one part of the broader positioning and sentiment layer. Its main value is to identify when expectations or exposure have become unusually one-sided, then place that observation beside the market evidence needed to judge whether the imbalance is persisting, stabilizing, or beginning to unwind.