The AAII sentiment survey is a weekly poll of AAII members that reports bullish, neutral, and bearish expectations for the stock market over the next six months. It is useful as a sentiment and positioning context input, especially when readings become extreme or persistent, but it is not a forecast, allocation model, or standalone market signal.
Definition: The AAII Sentiment Survey measures how individual investors responding to the survey say they expect the stock market to perform over the next six months, grouped into bullish, neutral, and bearish categories.
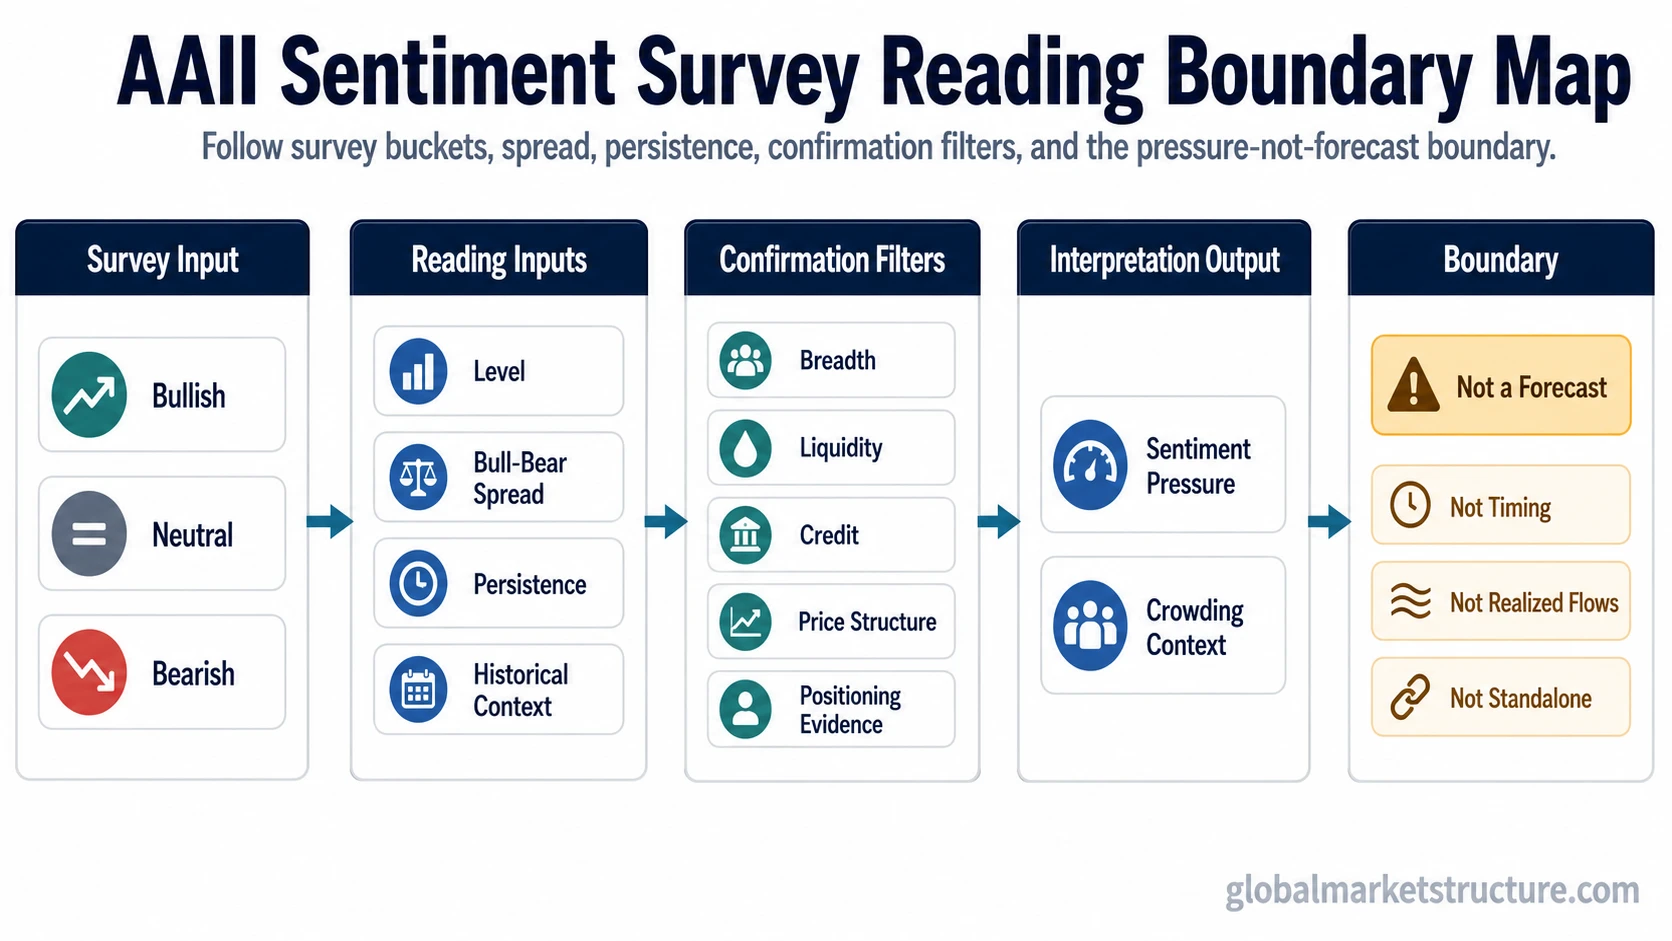
Current readings belong with AAII or a dated data source; the durable interpretation depends on level, persistence, bull-bear spread, and confirmation from broader market conditions.
Key Points
- The AAII sentiment survey reflects stated expectations from surveyed AAII members, not realized capital flows.
- Bullish, neutral, and bearish readings become more useful when compared with prior readings, historical context, and persistence.
- Extreme optimism or pessimism can add contrarian context, but it does not create an automatic reversal call.
- A one-week reading is weaker than a pattern confirmed by breadth, liquidity, credit, positioning, and price structure.
What the AAII Sentiment Survey Measures
The survey separates respondent expectations into three basic buckets. Bullish respondents expect the stock market to rise over the next six months, bearish respondents expect it to fall, and neutral respondents do not express a clear bullish or bearish expectation over that period.
The six-month framing matters because the survey is not a real-time trading flow measure. It captures sentiment at a weekly point in time. That makes it useful for reading investor mood, crowding pressure, and possible contrarian conditions, but weaker as a direct measure of actual positioning or future price direction.
The bull-bear spread is the difference between bullish and bearish responses. A wide positive spread can show optimism is much stronger than pessimism. A wide negative spread can show pessimism is much stronger than optimism. The spread becomes more meaningful when it is compared with historical norms and when the imbalance persists rather than appearing for only one week.
How AAII Readings Fit Market Sentiment
AAII readings work best as one input inside broader market sentiment. A high bullish reading may show optimism, but that optimism has a different meaning when breadth is strong, credit is calm, and liquidity is supportive than when participation is narrowing and risk conditions are deteriorating.
A high bearish reading may show pessimism or crowding risk, but it does not prove that selling pressure is exhausted. Bearish sentiment can remain elevated if liquidity remains tight, credit stress persists, or price structure continues to accept lower levels. The survey is most useful when it helps frame the pressure around expectations, not when it is asked to identify timing on its own.
Reading boundary: AAII sentiment can describe stated investor mood and possible crowding pressure. It does not fully measure realized fund flows, institutional positioning, dealer exposure, liquidity conditions, or future market direction.
AAII Sentiment Reading Framework
A stronger reading separates the level of sentiment from the quality of confirmation around it. The same bullish or bearish reading can carry different meaning depending on persistence, historical context, the bull-bear spread, and the surrounding market structure.
| Condition | Interpretation Use | Limitation |
|---|---|---|
| High bullishness | May show optimism, confidence, or crowding in positive expectations. | Not an automatic bearish reversal reading. |
| High bearishness | May show pessimism, fear, or crowded negative expectations. | Not an automatic bullish reversal reading. |
| Sharp one-week change | Can show that survey tone is shifting quickly. | Often too noisy without persistence or confirmation. |
| Persistent extreme | More useful than a single print because sentiment pressure is sustained. | Extreme sentiment can last longer than expected. |
| Wide bull-bear spread | Shows a stronger imbalance between optimism and pessimism. | Needs historical comparison and market context. |
| Breadth, liquidity, credit, and price confirmation | Strengthens the interpretation when several market-structure inputs point in the same direction. | Still does not turn the survey into a complete timing model. |
When AAII Sentiment Adds Contrarian Context
AAII sentiment can add contrarian context when optimism or pessimism becomes unusually stretched and the broader market begins to show exhaustion, stabilization, or reversal pressure. The survey is most useful in that role when the imbalance is persistent and other evidence begins to confirm that expectations may be crowded.
The contrarian interpretation weakens when the survey is isolated from market behavior. High bearishness may look like a possible upside contrarian condition, but the case remains incomplete if market breadth keeps weakening, liquidity remains poor, credit spreads continue to deteriorate, or price structure fails to stabilize. Broader contrarian signal logic depends on confirmation, not only on an opposite reading.
Limitation: Contrarian does not mean opposite immediately. It means sentiment may be crowded enough to deserve closer inspection. Timing still depends on confirmation from market structure, liquidity, positioning, credit, and breadth.
Reading Quality Checklist
A single AAII print becomes more useful when it is placed inside a structured reading process. The goal is to separate a sentiment headline from a higher-quality market interpretation.
- Level: Is bullishness, neutrality, or bearishness unusually high or low compared with normal ranges?
- Direction: Is sentiment shifting gradually, or did one weekly reading move sharply?
- Persistence: Has the condition lasted long enough to matter, or is it only a one-week change?
- Spread: Does the bull-bear spread show a clear imbalance between optimism and pessimism?
- Historical context: Are readings near historically notable levels, or still within a normal range?
- Market confirmation: Do breadth, liquidity, credit, positioning, and price structure support the same interpretation?
Example of an Incomplete AAII Sentiment Reading
Bearish AAII sentiment rises for several weeks, creating a tempting contrarian interpretation. At the same time, market breadth stops deteriorating, liquidity conditions improve, and credit stress does not expand. That combination can make the bearish reading more interesting, but it still does not prove that the market has turned.
The interpretation becomes more durable only if price structure begins to stabilize and participation broadens. If bearish sentiment rises while breadth keeps weakening and liquidity remains tight, the survey may describe pessimism without showing that the pressure has been absorbed.
Common Mistakes in AAII Sentiment Interpretation
The most common mistake is treating the survey as a direct map of actual positioning. Stated expectations can change before flows, positioning, or market structure change. A sentiment reading can highlight pressure, but it cannot prove that investors have already acted on those views.
Another mistake is overreacting to a single weekly move. A one-week jump in bullishness or bearishness may matter, but persistence usually carries more interpretive weight. Sentiment that remains stretched for several weeks gives a clearer read on crowding than a single volatile print.
A third mistake is using contrarian language without checking the surrounding regime. Extreme bearishness can coincide with opportunity, stress, or both. The distinction depends on whether liquidity, credit, breadth, and price behavior are stabilizing or still deteriorating.
Where AAII Sentiment Fits in a Market-Structure Process
AAII sentiment is strongest as a secondary input. It can help identify optimism, pessimism, imbalance, and crowding risk, but the interpretation should be tested against broader conditions. Market breadth can show whether participation is expanding or narrowing. Liquidity and credit can show whether risk appetite is supported or under pressure. Price structure can show whether the market is accepting or rejecting key areas.
That separation keeps the survey useful without overstating it. AAII sentiment can frame what investors say they expect, while market-structure evidence helps judge whether those expectations are being confirmed, challenged, or ignored by the broader market.
FAQ
What does the AAII sentiment survey measure?
It measures surveyed AAII members’ bullish, neutral, and bearish expectations for the stock market over the next six months.
Is the AAII sentiment survey a contrarian indicator?
It can support contrarian analysis when sentiment becomes unusually stretched, but it should be interpreted with persistence, historical context, and broader market confirmation.
Does one weekly AAII reading predict the market?
No. A single weekly reading can be noisy and should not be treated as a forecast, allocation model, or standalone market signal.
Why compare AAII sentiment with breadth, liquidity, and credit?
Those inputs help test whether survey sentiment is being confirmed by broader market conditions or remains only a stated-expectations reading.