
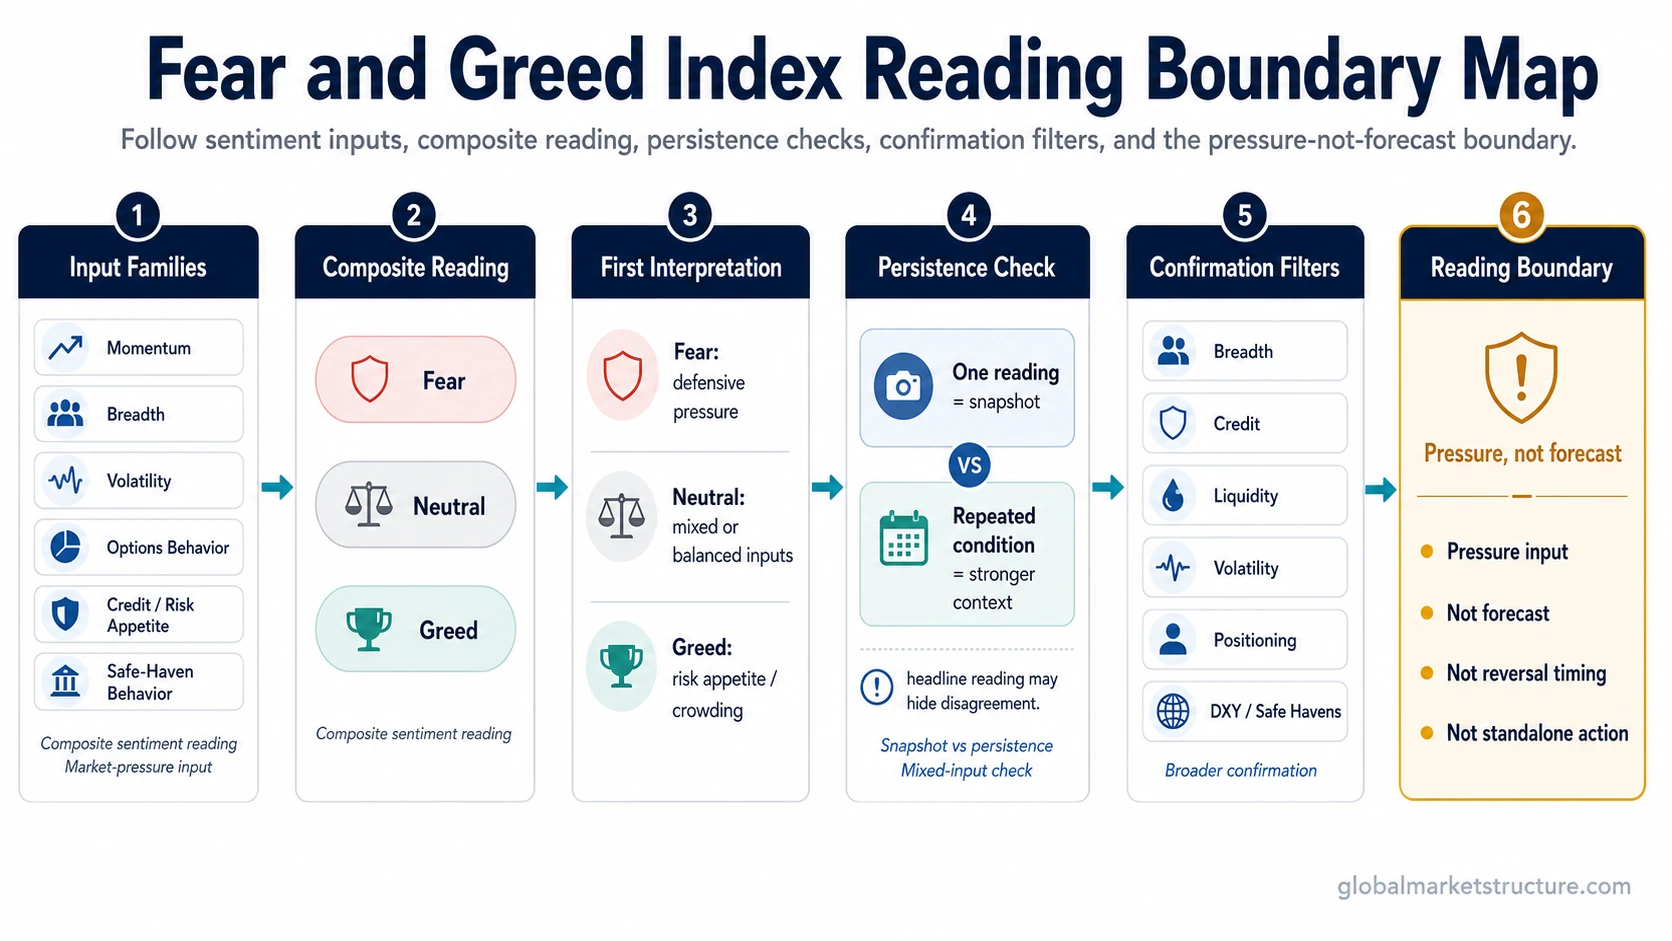
The Fear and Greed Index is a composite sentiment gauge that turns several market inputs into a single fear-to-greed reading. The exact inputs and calculation depend on the provider. CNN Business publishes a widely referenced U.S. stock-market version, while other indexes using the same general label can use different markets, components, and methods.
Provider Methodology Matters
CNN Business combines seven measures of stock-market behavior into a 0 to 100 Fear & Greed score. CNN states that the indicators receive equal weighting and that the components and index are recalculated as new data becomes available. A current CNN reading should therefore be checked at the provider rather than copied into a static educational page.
| CNN component | Underlying comparison | What it contributes |
|---|---|---|
| Market momentum | S&P 500 relative to its 125-day moving average. | Measures whether broad index momentum is stronger or weaker than its recent trend. |
| Stock price strength | NYSE stocks reaching 52-week highs relative to 52-week lows. | Measures strength across individual stocks rather than relying only on the headline index. |
| Stock price breadth | Advancing and declining volume through the McClellan Volume Summation Index. | Measures how participation is distributed beneath the market index. |
| Put and call options | Five-day average put/call ratio. | Measures whether options activity is leaning more heavily toward puts or calls. |
| Market volatility | VIX relative to its 50-day moving average. | Measures whether expected equity-market volatility is elevated or contained relative to its recent level. |
| Safe-haven demand | Relative stock and Treasury-bond returns over the previous 20 trading days. | Measures whether investors are favoring risk assets or safer assets. |
| Junk bond demand | Yield spread between lower-quality and higher-quality bonds. | Measures willingness to accept credit risk through the relative pricing of riskier debt. |
The CNN methodology is useful for understanding the stock-market version most readers encounter, but it should not be treated as a universal formula for every product carrying a Fear and Greed label. Provider, market universe, component definitions, and update method should be identified before comparing readings.
How Fear, Neutral, and Greed Readings Should Be Read
| Reading | What the composite describes | What still remains open |
|---|---|---|
| Fear | The selected components lean toward defensive or risk-averse conditions. | Whether pressure continues, stabilizes, or reverses. |
| Neutral | The composite is closer to the middle of its fear-to-greed range. | Whether the underlying components are genuinely balanced or offsetting each other. |
| Greed | The selected components lean toward stronger risk appetite and confidence. | Whether the condition remains supported or becomes increasingly one-sided. |
Component Checks and Independent Confirmation
A composite can hide disagreement between its components. Looking inside the index shows what is driving the headline reading. Independent confirmation requires evidence that is not already embedded in the same calculation.
Check whether the provider’s momentum, breadth, options, volatility, credit, or safe-haven components broadly agree or whether the headline score is being produced by conflicting inputs.
Compare the sentiment reading with separate evidence such as positioning data, liquidity or funding conditions, broader macro context, and price behavior not already represented by the provider’s formula.
For the CNN version, breadth, put/call activity, VIX, junk-bond demand, safe-haven demand, stock-price strength, and market momentum are already part of the index. Using the same components again as independent confirmation would count the same evidence twice.
How to Read a Fear and Greed Index
Confirm which index is being quoted, what market it covers, and how that provider constructs the score.
Establish whether the composite is leaning toward fear, neutrality, or greed within that provider’s scale.
Check whether the underlying measures broadly agree with the headline score or whether different parts of the composite are moving in opposite directions.
Compare the current reading with recent observations. A short-lived move carries different information from a condition that remains elevated or depressed.
Positioning, liquidity, funding conditions, macro context, and subsequent price behavior can show whether the sentiment condition is consistent with a broader market-structure change.
Interpretation Boundary
A composite score describes the condition represented by its inputs at that point in time. Strong fear can continue while market stress remains unresolved, and strong greed can continue while liquidity, momentum, or risk appetite remain supportive. The score alone does not establish reversal timing or the next market direction.
Illustrative Market-Structure Reading
Illustrative example: suppose the headline index remains in greed while several of its components still show strong risk appetite. That confirms the internal consistency of the composite. It does not provide a second independent signal.
The interpretation becomes more informative if separate evidence begins to diverge. Positioning may become increasingly concentrated, liquidity conditions may weaken, or price may stop responding to the same risk appetite that previously supported the move. In that situation, the sentiment reading still describes greed, while the broader market structure has become less uniform.
Fear and Greed Index, Market Sentiment, and Positioning
The Fear and Greed Index is one way to summarize market sentiment. Sentiment is the broader category: it includes confidence, caution, risk appetite, and behavioral pressure across markets. A composite index compresses selected measures of that environment into one score.
Positioning answers a different question by showing how participants are actually exposed. The Commitments of Traders report, for example, provides categorized futures-position data rather than a composite sentiment score. Sentiment and positioning can reinforce each other, or they can diverge.
Common Interpretation Errors
| Interpretation error | Why it can mislead | Better reading |
|---|---|---|
| Treating every Fear and Greed Index as the same product | Providers can use different markets, inputs, weights, and update methods. | Identify the provider and methodology before comparing scores. |
| Reading only the headline score | A composite can hide large differences between its underlying components. | Inspect which components are producing the fear or greed reading. |
| Counting index components as independent confirmation | Using the same breadth, volatility, options, credit, or safe-haven data again can duplicate evidence already embedded in the score. | Separate internal component checks from evidence outside the provider’s calculation. |
| Using an extreme as a reversal timer | Fear and greed conditions can persist while the surrounding market environment remains supportive of the existing move. | Treat the extreme as a sentiment condition and wait for separate market evidence before changing the interpretation. |
| Confusing sentiment with positioning | A composite sentiment score does not show how every participant is actually exposed. | Use positioning data when the analytical question concerns concentration, exposure, or potential unwind pressure. |