
A sentiment extreme becomes more useful near a potential market top when the reading persists and is joined by evidence of one-sided positioning, stretched flows, weakening participation, or more fragile liquidity. The extreme identifies a stretched condition. The surrounding market structure determines how much weight that condition deserves.
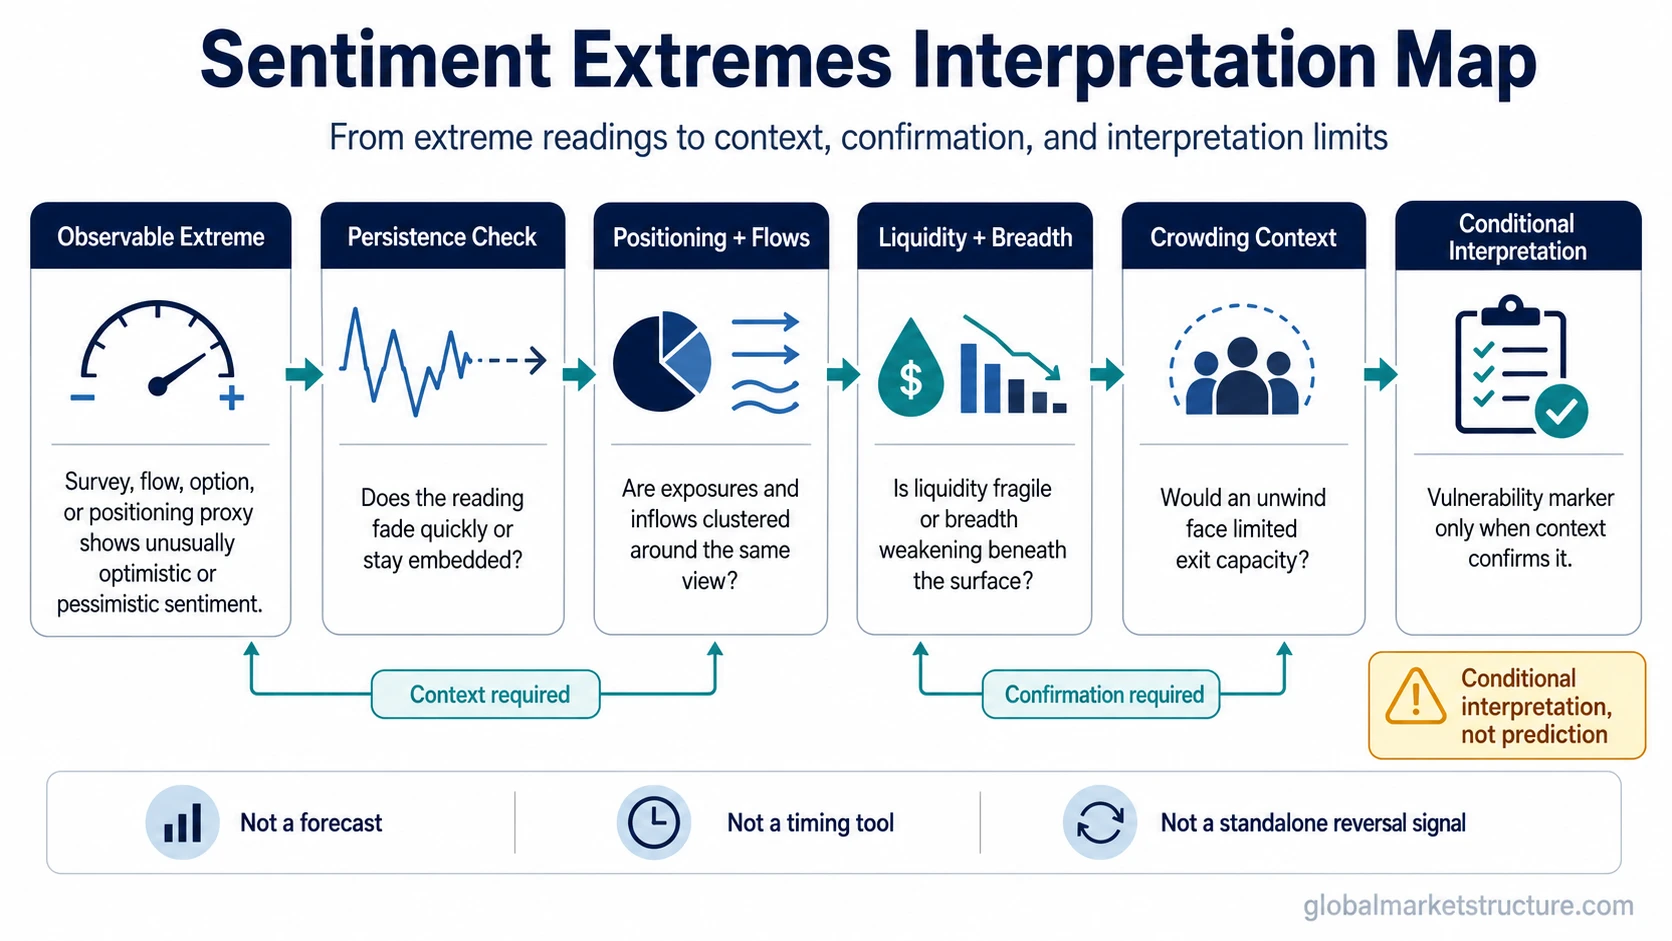
What Changes the Weight of a Sentiment Extreme
A sentiment extreme is an unusually optimistic or pessimistic reading relative to the history or normal range of the measure being used. The source and baseline matter because a stretched survey reading, an options-derived measure, and a broader sentiment dashboard do not necessarily have the same distribution or interpretation.
| Condition | Adds weight to the extreme | Reduces the immediate concern |
|---|---|---|
| Persistence | The reading remains unusually stretched across repeated observations. | The extreme fades quickly back toward its normal range. |
| Positioning and crowding | Exposure becomes increasingly concentrated around the same market view or continuation path. | Positioning remains more balanced despite strong expressed sentiment. |
| Flows | Continued inflows or outflows become increasingly one-sided or concentrated. | Flows remain diversified and the market absorbs changes without visible pressure. |
| Breadth and leadership | Headline strength depends on fewer securities or market segments. | Participation remains broad and leadership continues to expand. |
| Liquidity | The dominant exposure becomes more dependent on less forgiving liquidity conditions. | Liquidity remains supportive and positioning changes are absorbed without material stress. |
Sentiment Extreme vs Market-Top Evidence
Sentiment identifies how unusual the current mood or expectation has become. The market-top interpretation becomes stronger only when the extreme is accompanied by deterioration or fragility elsewhere in the market structure.
An unusually optimistic or pessimistic reading relative to the history of the specific measure.
Persistent optimism appears alongside more one-sided exposure, stretched flows, narrowing participation, weaker liquidity, or poorer price response.
Why an Extreme Does Not Identify the Exact Top
AAII’s Investor Sentiment Survey treats unusually bullish and bearish readings as contrarian information, while also warning that historical outcomes do not guarantee future results. In an AAII historical review, bullish sentiment reached 75% on January 6, 2000, yet the S&P 500 subsequently traded about 8.8% above that close before the longer decline developed. The extreme was informative, but it was not a precise marker of the final market top.
Bullish and Bearish Extremes Need Different Confirmation
| Extreme | What it establishes | What strengthens the interpretation | What can keep the condition in place |
|---|---|---|---|
| Extreme optimism | Expectations or risk appetite are unusually positive within the selected measure. | Persistent one-sided exposure, narrower leadership, increasingly concentrated flows, or weaker liquidity. | Broad participation, supportive liquidity, and continued demand can sustain optimistic conditions. |
| Extreme pessimism | Stress or risk aversion is unusually elevated within the selected measure. | Stabilizing breadth, less forced selling, improving liquidity, or reduced downside pressure. | Continued deleveraging, weak breadth, and poor liquidity can keep pessimism elevated. |
How to Interpret a Sentiment Extreme
Identify the survey, dashboard, options proxy, positioning measure, or other input and determine what qualifies as unusual within that specific series.
Separate a brief spike from an extreme that remains in place across repeated observations.
Look for evidence that the dominant view is also becoming concentrated in positioning or reinforced by increasingly one-sided flows.
Breadth, leadership, liquidity, and subsequent price response help show whether the market is still absorbing the dominant view or becoming more fragile around it.
Timing Limitation
Optimism can persist while liquidity, participation, and flows continue to support higher prices. Pessimism can remain elevated while deleveraging or liquidity stress is still developing. An extreme therefore changes the context of the analysis without defining the timing of a top, bottom, reversal, or continuation.
Sentiment Extremes and Related Concepts
| Concept | Primary job | Boundary from this page |
|---|---|---|
| Market sentiment | Describes the broader environment of confidence, caution, expectations, and risk appetite. | This page focuses only on how unusually stretched sentiment should be interpreted around potential turning points. |
| Investor sentiment indicators | Explains the tools and proxies used to observe sentiment. | The indicator measures the condition. This page focuses on what changes when that reading becomes unusually extreme. |
| Crowded trade | Examines concentration of similar exposure and potential exit pressure. | Crowding can strengthen the relevance of a sentiment extreme, but an extreme sentiment reading does not prove that exposure is already crowded. |
Common Interpretation Errors
| Interpretation error | Why it can mislead | Better reading |
|---|---|---|
| Calling a market top from one extreme reading | Sentiment can remain stretched while price, liquidity, and participation continue to support the existing trend. | Treat the extreme as a condition and look for deterioration in the surrounding market structure. |
| Using one universal threshold | Different surveys, dashboards, and proxies have different historical distributions and methodologies. | Define the extreme relative to the same measure and its own historical baseline. |
| Confusing sentiment with positioning | Strong optimism or pessimism does not establish how concentrated actual exposure has become. | Check positioning and flow evidence separately before making a crowding judgment. |
| Assuming bearish extremes identify exhaustion | Stress can remain visible while forced selling, weak liquidity, or deteriorating breadth continue. | Look for stabilization in the conditions that were sustaining the downside pressure. |