
ETF flows are the net money moving into or out of exchange-traded funds over a selected period. They can help show allocation pressure across funds, sectors, regions, and asset classes, but they do not forecast returns or act as a standalone market signal.
For market-structure analysis, ETF flows are most useful when they are separated from ETF trading volume, AUM changes, and price movement. A large reported flow number can reflect investor allocation demand, but the interpretation depends on the fund structure, time period, creation and redemption activity, rebalancing effects, and the broader market environment.
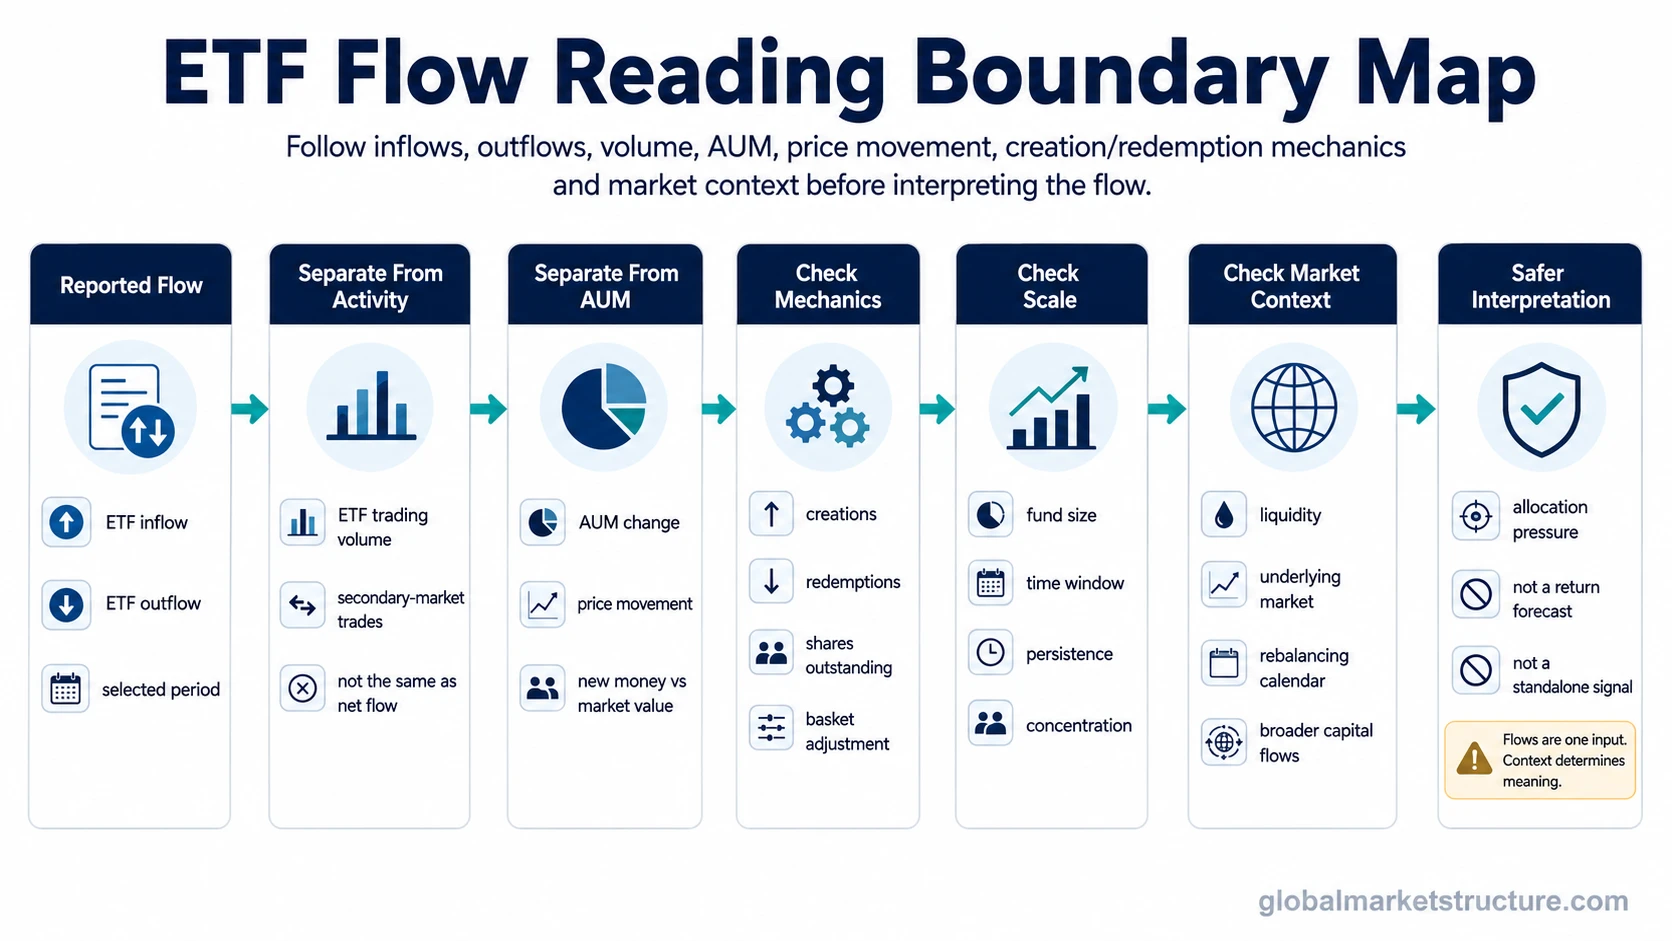
What ETF flows mean
Definition: ETF flows describe net movement into or out of an ETF structure. An ETF inflow means new money has moved into the fund over the measured period. An ETF outflow means money has moved out of the fund over the measured period.
Net ETF flow is usually read over a defined window, such as one day, one week, one month, or one quarter. The same flow number can mean different things depending on the size of the ETF, the liquidity of the underlying market, the asset class involved, and whether the move is persistent or temporary.
Key Points
- ETF flows measure net movement into or out of ETFs, not simply how often ETF shares trade.
- Inflows can reflect allocation demand for an ETF exposure, while outflows can reflect reduced exposure or portfolio rotation.
- ETF flows are different from ETF trading volume, AUM change, and ETF price return.
- Creation and redemption mechanics help connect ETF demand with shares outstanding and the underlying basket when primary-market activity is needed.
- Flow data is more useful when read with liquidity, price action, asset-class context, and broader capital-flow conditions.
How ETF inflows and outflows are measured
ETF flow data is commonly tied to changes in the fund’s shares outstanding and the value of those shares. ETF shares first trade in the secondary market between buyers and sellers. If demand or supply conditions require a primary-market adjustment, authorized participants may create new ETF shares or redeem existing shares.
The high-level sequence is simple:
- Investors seek more or less exposure through an ETF.
- ETF shares trade in the secondary market between buyers and sellers.
- If secondary-market trading is not enough to balance supply and demand, authorized participants may create or redeem ETF shares.
- The ETF’s shares outstanding and asset base adjust.
- Data providers report net flows for the chosen period.
The deeper mechanics belong with ETF creation and redemption, because that process explains how ETF share supply can adjust without treating every ETF trade as a direct purchase or sale of the underlying basket.
ETF flows vs ETF trading volume
ETF flow data and ETF trading volume answer different questions. Volume shows how much ETF trading occurred. Flow data tries to show whether money moved into or out of the ETF structure. A heavily traded ETF can have high volume with little net flow if buyers and sellers meet each other in the secondary market.
| Measure | What it tracks | Why it matters | Limitation |
|---|---|---|---|
| ETF flows | Net money moving into or out of the ETF structure over a period. | Can show allocation pressure toward or away from a fund exposure. | Does not automatically show future performance or direct price impact. |
| ETF trading volume | How many ETF shares trade in the secondary market. | Can show activity, liquidity interest, and transaction intensity. | High volume can occur without meaningful net inflow or outflow. |
| AUM change | Change in assets under management. | Can show how the fund’s asset base is changing. | AUM can change because of flows, price movement, or both. |
| ETF price return | Change in the ETF’s market price or NAV over a period. | Shows performance of the exposure during that period. | Price return is not the same as new money entering or leaving the fund. |
Why ETF flows matter for market structure
ETF flows matter because they can reveal how capital is moving across exposures. Persistent inflows into broad equity ETFs, bond ETFs, sector ETFs, commodity ETFs, or regional ETFs can show where portfolio demand is accumulating. Persistent outflows can show where exposure is being reduced.
That makes ETF flows part of the broader capital flows picture. They can help analysts see whether money is rotating between asset classes, concentrating in a narrow theme, moving into passive vehicles, or leaving a segment during a risk-off phase.
Flows are still only one input. A flow reading becomes more useful when it is compared with price behavior, liquidity conditions, market breadth, credit stress, rates, dollar conditions, and related fund-flow data.
What ETF flows can show
ETF flows can help identify allocation pressure, persistence, crowding, and rotation. A single day of inflows may only show short-term demand. A multi-week pattern across several related ETFs may say more about a broader allocation shift.
ETF flows can also help separate narrow product demand from wider market participation. For example, a thematic ETF may receive strong inflows while the broader sector remains weak. That does not automatically mean the whole asset class is attracting durable capital. It may only show concentrated demand for a narrow exposure.
What ETF flows cannot show
ETF flows cannot prove why investors moved money, whether the move will continue, or whether the underlying market will rise or fall. Flows can reflect portfolio rebalancing, model-portfolio changes, hedging activity, tax-related adjustments, short-related activity, issuer-specific product demand, or temporary liquidity needs.
Flow data also cannot replace fund flows analysis across the broader fund universe. ETF data can be fast and visible, but it does not always represent the full allocation picture across mutual funds, separate accounts, pensions, institutional mandates, and other vehicles.
ETF flow reading boundary table
The same ETF flow observation can support different interpretations depending on context. The safer reading starts with the observation, then checks what could distort or confirm it.
| Flow observation | Possible interpretation | What to check before reading it |
|---|---|---|
| Large inflow | Capital may be moving toward that ETF exposure. | Fund size, time period, price movement, underlying liquidity, and whether the inflow is isolated or persistent. |
| Large outflow | Investors may be reducing exposure or rotating elsewhere. | Whether the outflow reflects rebalancing, tax effects, model changes, or temporary liquidity needs. |
| Persistent inflows | Allocation pressure may be building over time. | Whether price, breadth, liquidity, and related assets confirm wider participation. |
| One-day flow spike | A temporary flow event may have occurred. | Rebalancing calendar, index changes, fund events, large portfolio transitions, and abnormal volume. |
| Sector or thematic concentration | Demand may be concentrated in one narrow exposure. | Whether the broader sector, industry group, or asset class shows similar participation. |
| Flow without price confirmation | Allocation demand and market performance may be diverging. | Underlying selling pressure, liquidity depth, valuation pressure, macro conditions, and whether inflows are being absorbed. |
Example scenario: inflows without a clean price signal
A broad ETF can receive inflows during a period when its underlying market is falling. That can happen if long-term allocators add exposure during weakness, if model portfolios rebalance back toward target weights, or if new shares are created while existing holders continue selling in the underlying market.
The flow number shows that money entered the ETF structure. It does not prove that the underlying market has finished falling. The interpretation improves only after checking whether price stabilizes, liquidity improves, market breadth broadens, and related exposures confirm the same allocation shift.
ETF flow interpretation limits
ETF flows are not a standalone bullish or bearish signal. They can help show allocation pressure, but the reading can be distorted by rebalancing, market-cap changes, fund size, issuer-specific product demand, asset-class rotation, hedge activity, and mechanical creations or redemptions.
The strongest use is contextual. Flow direction should be read alongside liquidity, breadth, credit, rates, DXY, volatility, and broader risk-regime evidence when those conditions are relevant to the ETF exposure.
Common mistakes when reading ETF flows
- Confusing volume with flows: ETF shares can trade heavily without much net money entering or leaving the fund structure.
- Confusing AUM growth with flows: AUM can rise because the ETF’s holdings increased in value, not only because new money entered.
- Reading one fund as the whole market: A narrow ETF can show strong flows while broader participation remains weak.
- Ignoring rebalancing effects: Scheduled allocation changes can create flows that do not represent a fresh market view.
- Treating flows as forecasts: Flow direction can show positioning pressure, but it does not guarantee the next price move.
Related concepts
ETF flow interpretation becomes clearer when the ETF mechanism and the broader allocation map are separated. Passive flows explain how rule-based and index-linked allocation can affect markets, while active vs passive fund flows separate discretionary allocation changes from systematic vehicle flows.
Index rebalancing matters when flows reflect benchmark changes or portfolio target adjustments rather than new directional conviction. These related concepts help keep ETF flow data inside a broader allocation and market-structure framework.
FAQ
Are ETF flows the same as ETF trading volume?
No. ETF trading volume measures how many ETF shares trade in the secondary market. ETF flows measure net money moving into or out of the ETF structure over a period. High trading volume can occur without a large net inflow or outflow.
Do ETF inflows mean prices will rise?
No. ETF inflows can show demand for an ETF exposure, but they do not guarantee price gains. Price behavior depends on the underlying market, liquidity, valuation, macro conditions, and whether other investors are selling into the demand.
Can ETF outflows be misleading?
Yes. ETF outflows can reflect portfolio rebalancing, model changes, tax effects, liquidity needs, or fund-specific adjustments. They should not be read as a complete market view without checking price, AUM, volume, and related exposures.
How do creations and redemptions affect ETF flows?
Creations and redemptions help adjust ETF share supply when demand changes. When shares are created, the ETF structure can receive new assets. When shares are redeemed, assets can leave the structure. The flow reading depends on the period, fund size, NAV, and shares outstanding.