
Carry and roll-down combines the return from holding a fixed-income or rates exposure with the value effect of that exposure moving to a shorter point on the yield curve as time passes. Carry can include coupon, accrual, or relevant financing effects. Roll-down depends on the shape of the curve and the maturity point the exposure moves toward. The result is a starting estimate under stated assumptions, while actual rates, spreads, funding, and holding conditions determine realized performance.
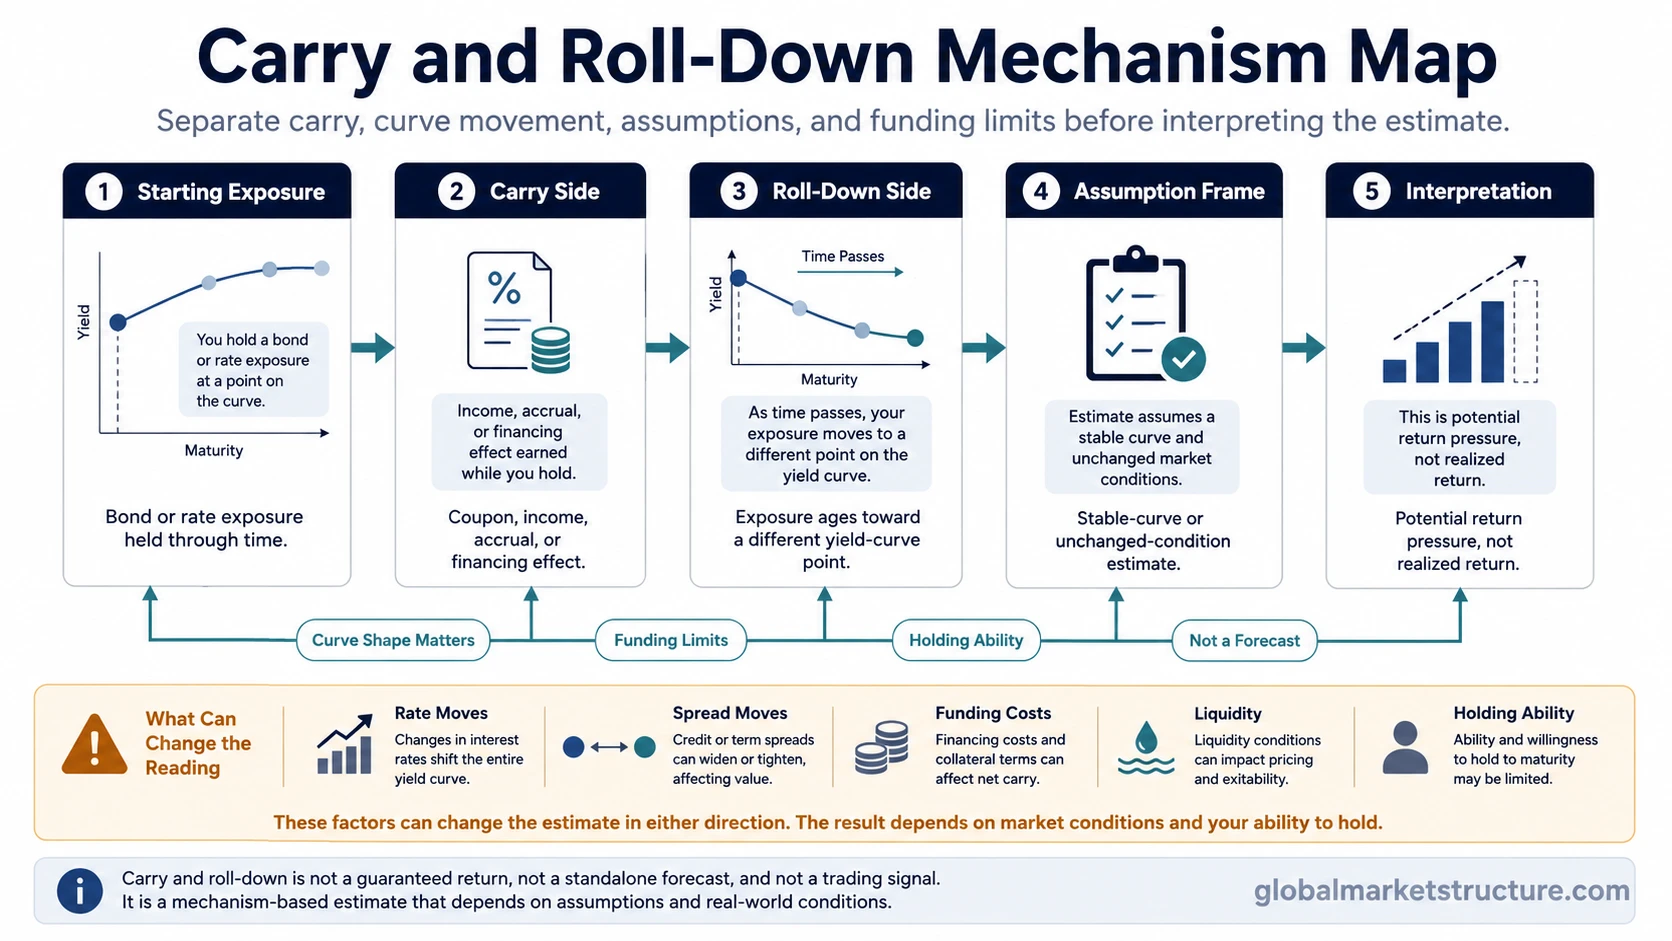
Carry vs Roll-Down
| Part | What it describes | What can change the reading |
|---|---|---|
| Carry | Income, coupon, accrual, or relevant financing effect over the holding period. | Coupon level, funding cost, repo cost, hedge cost, and position structure. |
| Roll-down | Value effect from the exposure moving toward a shorter maturity point on the yield curve. | Curve shape, local slope, maturity point, and the curve assumption used for the estimate. |
| Carry and roll-down | The combined starting effect of carry and estimated movement along the curve over a chosen horizon. | Rate moves, spread moves, funding conditions, transaction costs, and the ability to maintain the exposure. |
For the curve-only effect, bond roll-down focuses on the price and yield effect of a bond aging toward a shorter maturity point. Carry and roll-down adds the holding-period income or financing layer.
FTSE Russell notes that some definitions treat roll-down as a separate component, while others include the roll-down effect within a broader carry measure. This page uses the separate-component convention so the holding-period carry and curve-movement effects remain visible.
How to Build a Carry-and-Roll-Down Estimate
Define the bond or rate exposure, its current maturity point, and the period over which the estimate will be read.
Include the relevant coupon, accrual, income, financing, or hedge effects for the position being analyzed.
Move the exposure to the shorter maturity point it would occupy at the end of the horizon and value that change under the chosen curve assumption.
The starting estimate can be compared with later changes in yields, curve shape, spreads, funding, and liquidity rather than treating those changes as part of the original carry-and-roll-down number.
Static Estimate vs Realized Return
Carry and roll-down isolates a holding-period return component under stated assumptions. Realized performance also reflects what actually happens to yields, curve shape, spreads, funding, and other position costs during the horizon.
Carry plus estimated roll-down under a chosen horizon and curve convention.
The starting components combined with the market, spread, funding, and execution changes that occur while the exposure is held.
CFA Institute describes expected fixed-income portfolio return as combining coupon income and rolldown return with expected changes in benchmark yields, credit, and other relevant exposures over the investment horizon. Keeping those layers separate makes the assumptions behind a carry-and-roll-down estimate easier to inspect.
| What changes | Why the estimate can change | Interpretation |
|---|---|---|
| Benchmark yields or curve shape | The exposure can be repriced at a different yield than the starting curve assumption implied. | The realized price effect can be larger or smaller than the original roll-down estimate. |
| Credit or liquidity spreads | Spread movement can change valuation independently of the expected maturity roll. | Positive carry and roll-down can be offset by adverse spread repricing. |
| Funding and margin | Financing costs or collateral requirements can move during the holding period. | Funding stress can raise the cost of maintaining the exposure and change the economics of the original estimate. |
| Liquidity and holding horizon | The position may need to be reduced before the modeled horizon is reached. | The expected time effect may not have enough time to develop as originally modeled. |
A Simple Return Decomposition
Assume an exposure has an estimated 2.0% carry contribution over the chosen holding period and an estimated 1.0% roll-down contribution under the starting curve assumption. The combined starting estimate is 3.0%.
| Component | Illustrative contribution |
|---|---|
| Carry over the holding period | +2.0% |
| Estimated roll-down | +1.0% |
| Starting carry-and-roll-down estimate | +3.0% |
| Adverse market repricing during the period | -4.0% |
| Simplified result from these components | -1.0% |
The numbers are illustrative and show only the decomposition. A specific bond or swap requires instrument-specific pricing inputs. In this example, the 3.0% starting estimate is more than offset by the -4.0% market repricing effect.
Bond and Swap Context
For a bond, carry can include coupon income and relevant financing effects, while roll-down reflects how the bond may be valued as it ages to a shorter maturity point on the curve. An upward-sloping section of the curve can create a favorable roll-down estimate if the shorter maturity point carries a lower yield under the chosen curve assumption. A flat or inverted section can reduce or reverse that effect.
Swaps and other rate exposures can express the same broad idea through accrual, forward rates, curve shape, and financing or hedging terms. The calculation depends on the instrument, so the combined measure is better read as a return decomposition under explicit assumptions than as one universal formula.
Why Carry and Roll-Down Matters for Market Structure
Carry and roll-down can influence how fixed-income and rates participants compare exposures across maturities and curve segments. A position that appears attractive under a stable set of assumptions may become less attractive when the rate path, curve shape, spread environment, or funding backdrop changes.
The broader carry trade family can include currencies, volatility, funding spreads, and cross-asset structures. Carry and roll-down stays focused on fixed-income or rates exposure and the interaction between holding-period carry and movement along a curve.
The estimate assumes the exposure can remain in place through the chosen horizon. Rising financing costs, higher margin requirements, or weaker liquidity can make the position harder to maintain before the modeled time effect is realized.
Carry and Roll-Down vs Nearby Concepts
| Concept | Main focus | Boundary |
|---|---|---|
| Carry and roll-down | Holding-period carry combined with the value effect of moving along the yield curve. | Owns the combined fixed-income or rates reading under stated horizon and curve assumptions. |
| Bond roll-down | Price and yield effect of a bond aging along the curve. | Focuses on the curve-only aging effect rather than the combined carry measure. |
| Fixed-income carry | Income, accrual, or financing side of holding fixed-income exposure. | Does not by itself include the separate curve roll-down effect used on this page. |
| Carry trade | Broader carry positioning across funding, currencies, rates, volatility, or other assets. | Extends beyond the fixed-income carry-and-roll-down relationship. |
| Funding stress | Pressure on financing, collateral, margin, liquidity, and holding capacity. | Describes a condition that can weaken or interrupt a carry structure rather than the carry-and-roll-down estimate itself. |