
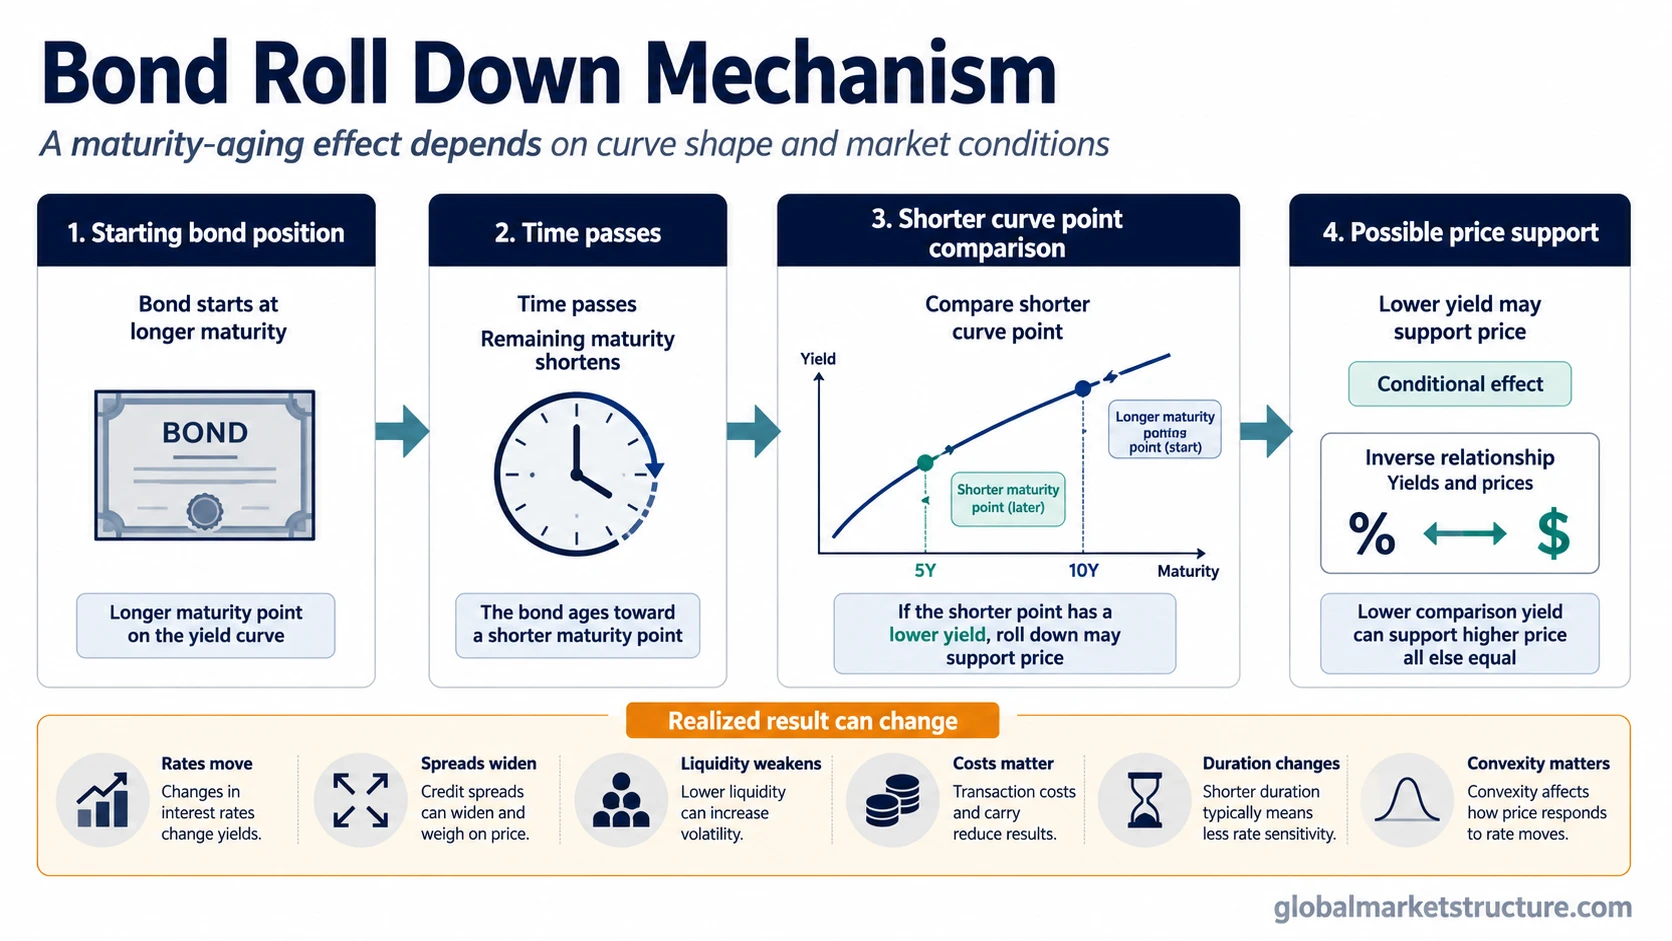
Bond roll-down is the price or return effect that can arise as a bond ages toward a shorter maturity point on the yield curve. Under an unchanged upward-sloping curve, the shorter-maturity comparison yield may be lower, which can support the bond’s price. The roll-down component should be separated from coupon income and from later changes in the yield curve.
How Bond Roll Down Works
A bond’s remaining maturity falls as time passes. A bond with five years remaining today will have four years remaining one year from now. Under a static yield-curve assumption, it is then valued using the part of the curve associated with that shorter remaining maturity.
If that shorter point carries a lower yield, the inverse relationship between bond price and yield can create a positive price effect. If the relevant curve segment is flat, the effect may be small. If the bond ages toward a higher-yielding point, the roll-down component can be negative.
Bond Roll Down vs Fixed-Income Carry
Roll-down isolates the valuation effect associated with the bond moving to a shorter point on the curve. Carry captures income, accrual, and relevant financing effects from holding the exposure.
Price or return effect associated with maturity shortening and movement along the yield curve.
Income, accrual, and relevant financing effects generated while the fixed-income exposure is held.
How Curve Shape Changes Roll-Down
| Curve condition | Roll-down reading | What can change it |
|---|---|---|
| Upward-sloping segment | A bond may age toward a lower-yielding point, creating positive expected roll-down. | The curve can shift or change shape before the holding horizon is reached. |
| Flat segment | Nearby maturities carry similar yields, so the expected roll-down component may be small. | Even modest curve movement can become larger than the initial roll-down estimate. |
| Inverted segment | The bond may age toward a higher-yielding point, creating negative expected roll-down. | A later steepening or other curve repricing changes the original comparison. |
| Changing curve shape | The original static-curve estimate no longer describes the realized path. | Changes in level, slope, or curvature alter the yield used to value the bond at the horizon. |
How to Estimate Bond Roll-Down
A clean roll-down estimate begins with an explicit holding horizon and an unchanged-curve assumption. The purpose is to isolate the maturity-aging component before adding coupon income or a separate view on future yields.
Record the bond’s current maturity and the shorter remaining maturity it will have at the end of the selected period.
Use the yield associated with the shorter maturity point while holding the starting curve unchanged for the base calculation.
Compare the horizon bond value with the starting value. Coupon income and other carry components remain separate.
A general full-revaluation expression is:
Roll-down return = (Horizon price under the stated curve assumption − Starting price) ÷ Starting price
Illustrative approximation: Suppose a bond sits near the five-year point at a 4.50% yield, while the four-year point is 4.20%. After one year, an unchanged curve implies a 30-basis-point lower comparison yield. With modified duration of approximately 4.0, a first-order price approximation is:
−4.0 × (−0.0030) ≈ +1.2%
The 1.2% is an approximate roll-down price effect for the illustration. Coupon income is excluded. Convexity, curve movement, spread changes, and other position-specific effects can change the realized return.
CFA Institute separates coupon income and rolldown return in its fixed-income expected-return framework. Its yield-curve strategy material also treats roll-down under a static or expected curve framework and uses duration and convexity to evaluate bond price sensitivity.
When the Starting Roll-Down Estimate Stops Applying
The bond ages toward a different maturity point while the reference curve is held unchanged.
The curve shifts, steepens, flattens, changes curvature, or the bond’s relevant spread changes before the horizon.
The original roll-down remains a description of the starting assumption, while the realized bond return must be calculated from the market conditions that actually developed.
Liquidity and transaction costs can also affect the return obtained from an actual position. Those effects belong to the realized holding result rather than to the curve-only definition of roll-down.
Where Bond Roll Down Fits in Fixed-Income Analysis
Bond roll-down isolates the curve effect first. Carry and roll-down then combines that curve component with the income or financing side of the exposure and the assumptions required to estimate the broader holding-period result.