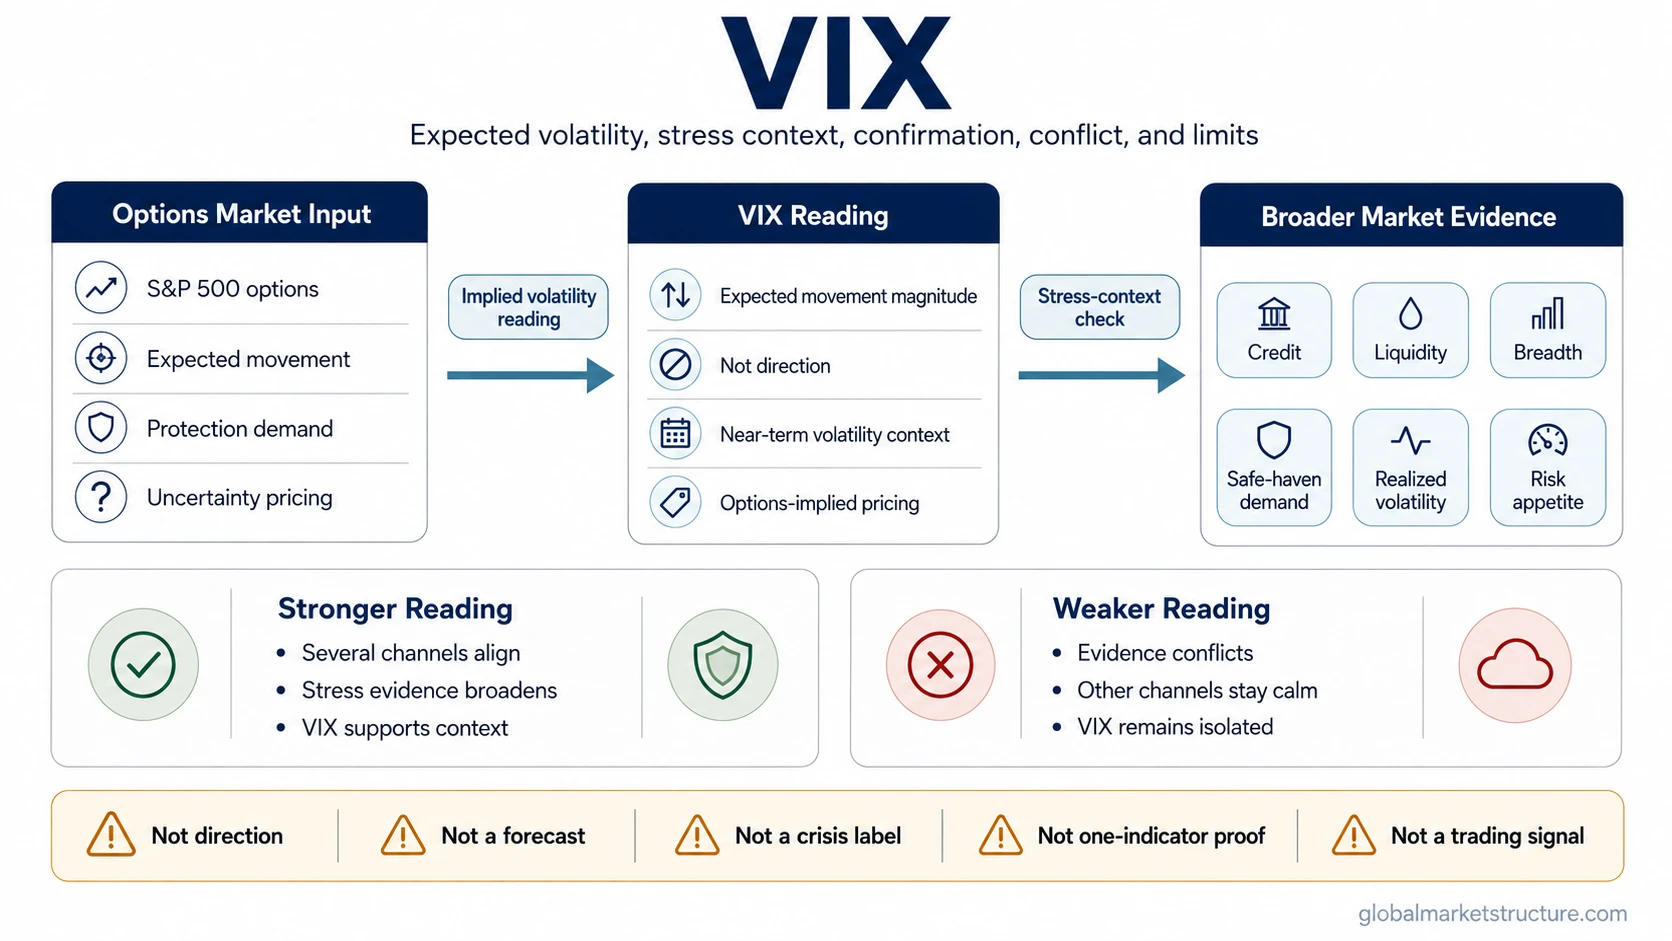
VIX is the Cboe Volatility Index, an options-implied measure of expected S&P 500 volatility over roughly the next 30 days. It reflects the magnitude of expected movement priced through options, not the market’s direction. VIX can help interpret stress pricing, but it is not a forecast, not standalone proof of market stress, and not a buy or sell signal.
Key Points
- VIX measures expected volatility implied by S&P 500 options, not the future direction of the index.
- High VIX can show expensive volatility protection or stress pricing, but it does not identify a specific market outcome.
- Low VIX can show calmer expected movement, but it does not prove that risk has disappeared.
- VIX becomes more useful when it is compared with credit, liquidity, breadth, safe-haven demand, and realized volatility.
What VIX Measures
VIX measures expected near-term volatility in the S&P 500 as implied by options prices. It is built from the options market rather than from past price movement, which makes it a forward-looking volatility gauge rather than a record of what already happened.
The central idea is simple: when option prices imply larger expected movement, VIX tends to rise. When options imply smaller expected movement, VIX tends to fall. The index does not say whether the S&P 500 is expected to rise or fall. It reflects the expected size of movement, not the expected direction.
Compact definition: VIX is an options-implied expected-volatility index for the S&P 500. It helps show how much movement the options market is pricing over a near-term horizon, but it does not forecast direction or confirm a complete stress regime by itself.
How VIX Works in Simple Terms
VIX starts with S&P 500 options. Options become more expensive when market participants demand more protection, expect wider price movement, or price greater uncertainty. That higher implied movement feeds into the VIX calculation.
- S&P 500 options price expected future movement.
- Higher implied movement usually lifts implied volatility.
- VIX converts that options-implied volatility into a standardized index reading.
- The reading becomes a stress-context input only after comparison with broader market evidence.
The useful interpretation is not “VIX is high, therefore the market must fall.” A cleaner reading is that the options market is pricing a larger expected movement range. Direction still depends on other evidence, including trend, liquidity, positioning, credit conditions, and risk appetite.
Why VIX Is Called the Fear Index
VIX is often called the fear index because it tends to rise when demand for downside protection increases. During uncertain periods, investors may pay more for options that protect against large moves. That can lift implied volatility and push VIX higher.
The phrase “fear index” is useful shorthand, but it can also mislead. VIX is not a direct survey of fear, and it is not a complete measure of panic. It is a market-pricing measure derived from options. Fear, uncertainty, hedging demand, dealer positioning, and volatility supply can all influence the reading.
VIX vs Volatility, Implied Volatility, and Realized Volatility
VIX is related to volatility, but it is not the same as every type of volatility. Volatility is the broad concept of price-movement magnitude. VIX is a specific index tied to expected S&P 500 volatility from options pricing.
| Concept | Meaning | How it relates to VIX |
|---|---|---|
| Volatility | General magnitude of price movement. | VIX is one specific volatility index, not the whole volatility concept. |
| Implied volatility | Expected movement inferred from options prices. | VIX is based on implied volatility in S&P 500 options. |
| Realized volatility | Actual movement that has already occurred over a measured period. | VIX can diverge from realized volatility because it reflects expected movement, not past movement. |
This distinction matters because expected volatility can rise before realized volatility rises, fall while realized volatility remains elevated, or stay low while other forms of risk are building outside the options market.
What VIX Can and Cannot Tell You
VIX is most useful when it is treated as a boundary-setting tool. It can show how much near-term movement is being priced into S&P 500 options, but it cannot replace a broader market-stress framework.
| VIX can help show | VIX cannot prove | Check next |
|---|---|---|
| Expected movement is being repriced higher. | The S&P 500 must fall. | Trend, breadth, credit spreads, liquidity, and safe-haven behavior. |
| Options protection is becoming more expensive. | A market crash is coming. | Whether stress is spreading across assets and funding channels. |
| Expected volatility is calming. | Markets are safe. | Whether complacency conflicts with weakening internals or deteriorating liquidity. |
| A sudden volatility spike is occurring. | The spike is automatically a durable regime change. | Whether realized volatility, credit stress, and risk appetite confirm the move. |
Limitation: VIX is a strong volatility-context input, but it is a weak standalone decision tool. It can support a stress reading when other evidence aligns, but it can also give incomplete or noisy signals when options pricing moves faster than credit, liquidity, breadth, or cross-asset confirmation.
How VIX Fits Market Stress and Risk Appetite
VIX becomes more useful when it is placed inside a broader risk-environment map. A rising VIX can reflect greater demand for protection or wider expected movement. The interpretation strengthens when credit spreads widen, liquidity weakens, market breadth deteriorates, and defensive assets attract demand at the same time.
The interpretation weakens when VIX rises but other stress channels remain calm. For example, a short volatility shock can lift VIX even if credit markets, funding conditions, and participation remain stable. In that case, VIX may show repriced uncertainty without confirming a broader stress environment.
The same logic applies to low VIX. A low reading can reflect calm expected movement, but it does not guarantee a healthy regime. If breadth is narrowing, liquidity is deteriorating, or risk appetite is weakening beneath the surface, low VIX may show calm options pricing rather than low systemic risk.
A Practical Stress-Context Scenario
A practical scenario is a market where VIX rises while credit spreads widen, liquidity conditions weaken, participation narrows, and demand for defensive assets increases. That combination makes the VIX move more meaningful as a stress-context reading because several channels point in the same direction.
The conclusion still has to stay limited. The signal does not forecast a specific index path, identify a trade, or prove that a crisis is underway. It only says that options-implied volatility is aligning with other signs of strain, which makes the market environment less calm than VIX alone could prove.
Common False Readings
A high VIX reading is often misread as a direct market-bottom signal. That is unsafe because high expected volatility can appear during disorderly selling, unstable rebounds, or two-way repricing. It shows a wider expected movement range, not a confirmed reversal.
A low VIX reading is often misread as proof that markets are stable. That can also be unsafe. Low expected volatility can coexist with crowded positioning, narrow leadership, weak breadth, or fragile liquidity. Calm options pricing is only one part of the risk picture.
Another false reading is treating VIX as a complete risk-off indicator. VIX can support a risk-off interpretation, but it needs confirmation from other signals such as credit conditions, safe-haven demand, market breadth, and cross-asset behavior.
Related Concepts to Understand Next
VIX is easiest to interpret after separating expected volatility from broader stress diagnosis. The next logical concept is market stress because stress requires multiple channels to align, not only a volatility index.
Volatility and implied volatility clarify the measurement side. A volatility spike helps explain sudden repricing behavior. Broader risk-environment concepts such as credit spreads, liquidity, safe-haven demand, and risk appetite can help confirm whether the VIX reading is isolated or part of a wider regime shift.
Bottom Line
VIX is an options-implied expected-volatility gauge for the S&P 500. Its strongest use is not prediction. Its strongest use is context: how much near-term movement the options market is pricing, whether that pricing is changing quickly, and whether broader market evidence confirms or contradicts the stress message.
FAQ
What is the VIX in simple terms?
VIX is the Cboe Volatility Index. It reflects the amount of near-term S&P 500 movement implied by options prices, usually described as expected volatility over roughly the next 30 days.
Does VIX show market direction?
No. VIX reflects expected movement magnitude, not direction. A higher reading means options are pricing larger expected movement, but it does not say whether the S&P 500 will rise or fall.
Why is VIX called the fear index?
VIX is called the fear index because it often rises when investors pay more for protection during uncertain periods. The nickname is incomplete because VIX is an options-pricing measure, not a direct measurement of fear.
Is a high VIX a buy signal?
No. A high VIX is not a buy signal. It can show elevated expected volatility or stress pricing, but it does not confirm a market bottom, reversal, or trade setup.
Can low VIX mean markets are safe?
No. Low VIX can show calm expected movement in options pricing, but it does not prove that broader market risk is low. Credit, liquidity, breadth, positioning, and cross-asset behavior still matter.