
Implied volatility is a volatility level inferred from option prices. It is commonly used as a forward-looking measure of the movement magnitude priced into an option, but it does not specify market direction or guarantee how much volatility will later be realized. Within volatility analysis, the reading is most useful when the contract, strike, expiration, and surrounding market context are clear.
How Implied Volatility Is Derived
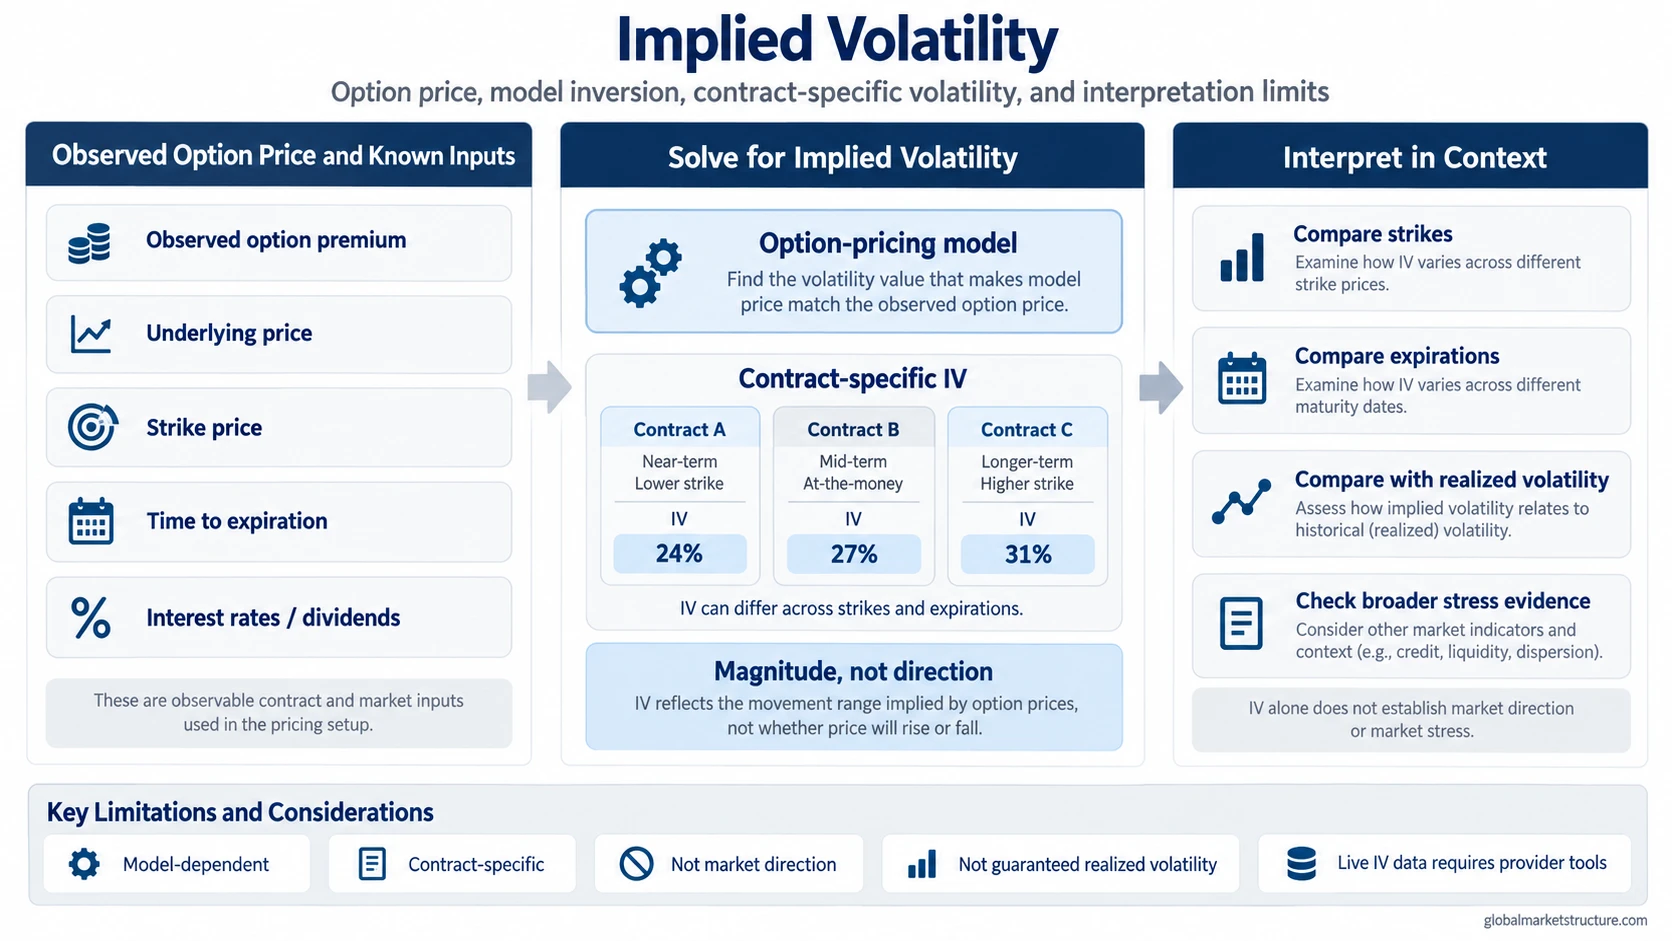
An option-pricing model normally takes volatility as one of its inputs. Once the option is trading in the market, the calculation can be run in reverse: the observed option price and the other model inputs are used to solve for the volatility level consistent with that price.
The calculation starts with the market price of the option together with inputs such as the underlying price, strike, time to expiration, rates, and applicable dividends.
The volatility input is adjusted until the model price is consistent with the observed option price.
The result belongs to that option contract and can then be compared with other strikes, expirations, or volatility measures.
Cboe methodology illustrates the inversion by calculating the volatility level that makes an option-pricing model consistent with an observed market option price. CME education also shows that implied volatility can be calculated for specific options at specific strikes. Source: Cboe methodology. Source: CME Group.
Implied Volatility Is Contract-Specific
Each option contract has its own strike and expiration. Differences in option prices across those contracts produce different implied-volatility readings rather than one universal IV value for the entire underlying.
Its IV is inferred from that contract’s market price and the inputs used in the pricing model.
Comparing contracts reveals how implied volatility varies across strikes and expirations.
For example, two options on the same underlying with different expirations can carry different implied-volatility readings at the same moment. A single displayed IV number therefore needs a clear contract, strike, maturity, or benchmark definition.
What Implied Volatility Can and Cannot Tell You
| IV can help show | IV does not establish |
|---|---|
| The magnitude of movement being priced into a specific option context. | Whether the underlying will rise or fall. |
| How option-market volatility pricing changes over time. | How much volatility will actually be realized. |
| Differences in volatility pricing across strikes or expirations. | One unique cause for those differences. |
| A volatility input that can contribute to broader risk interpretation. | A complete market-stress diagnosis by itself. |
Implied Volatility and Realized Volatility
Implied volatility is inferred from current option prices for a future horizon. realized volatility measures price variability that has already occurred over a chosen observation window.
The two measures can differ because they answer different questions and may refer to different horizons or measurement conventions. The dedicated implied vs realized volatility comparison covers that relationship in detail.
How Implied Volatility Fits Stress Analysis
A rise in implied volatility can show that options are pricing a wider movement range or greater uncertainty. The observation becomes more relevant to market-stress analysis when other channels also show strain. If credit, liquidity, breadth, and realized volatility remain orderly, the IV move may remain specific to the option market, a contract segment, or a particular horizon.
IV does not identify direction, guarantee future realized volatility, explain its own cause, or establish a market regime on its own. Interpretation should stay tied to the contract definition and to the other evidence relevant to the question being asked.