
Profit margins measure how much revenue remains as profit after costs are deducted, usually expressed as a percentage of revenue. Gross, operating, and net margins each capture a different cost layer, and changes across those layers can reveal pricing power, cost pressure, operating leverage, inflation sensitivity, and earnings-cycle pressure.
Definition: Profit margin is profit divided by revenue, expressed as a percentage. A 20% profit margin means that 20 cents of every revenue dollar remains as profit at the measured layer of the income statement.
The formula is simple, but the interpretation is not. The same headline margin can mean different things depending on industry structure, revenue growth, cost inflation, product mix, financing costs, tax effects, and whether the margin level is expanding, compressing, or temporarily distorted.
Key Points
- Profit margins express profit as a percentage of revenue.
- Gross, operating, and net margins measure different cost layers.
- Margin changes can reveal cost pressure, pricing power, operating leverage, and earnings sensitivity.
- Sector norms, one-time items, and accounting classification can make simple comparisons misleading.
- Profit margins are interpretation inputs, not market-timing signals.
What Profit Margins Mean
Profit margins connect revenue to profitability. Revenue shows the size of sales, while profit margin shows how much of those sales survives after specific costs. That makes margins useful for separating top-line growth from actual earnings quality.
The basic formula is:
Profit margin formula: Profit margin = profit ÷ revenue × 100.
The profit figure changes depending on the margin being measured. Gross margin uses gross profit, operating margin uses operating income, and net margin uses net income. A margin reading therefore needs the correct layer before it can be interpreted.
For market-structure interpretation, the direction of margins can matter more than the isolated level, especially when the trend persists across reporting periods or appears across a sector.
Gross, Operating, and Net Profit Margins
The main margin types separate cost pressure into layers. This distinction matters because a company, sector, or broad earnings cycle can look strong at one layer and weaker at another.
| Margin type | Basic formula | What it captures | What it can suggest | What it cannot prove |
|---|---|---|---|---|
| Gross profit margin | Gross profit ÷ revenue × 100 | Revenue after direct production or service costs | Pricing power, input-cost pressure, production efficiency, product mix | Full profitability after operating expenses, interest, taxes, or one-time items |
| Operating profit margin | Operating income ÷ revenue × 100 | Profitability after core operating expenses | Operating leverage, expense discipline, scale effects, demand sensitivity | Final earnings after financing costs, taxes, non-operating gains, or losses |
| Net profit margin | Net income ÷ revenue × 100 | Final profit after all major expenses and non-operating items | Bottom-line earnings pressure, financing burden, tax effects, full-cycle profitability | Whether the margin move came from core operations, accounting items, or temporary effects |
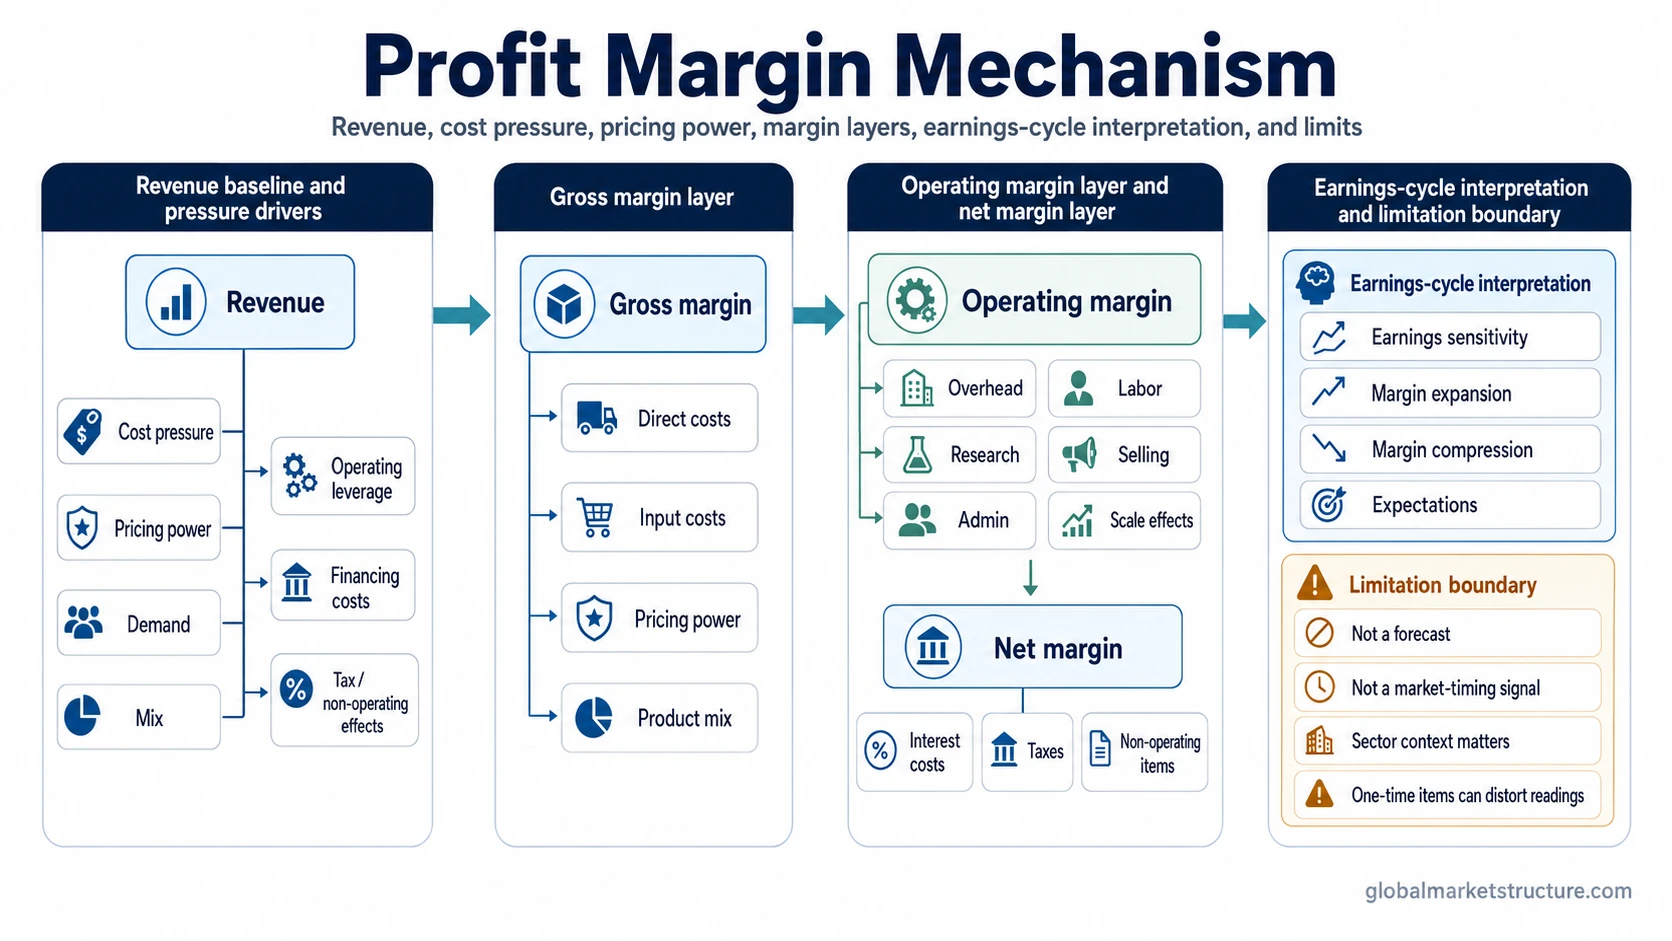
Gross margin can be one of the first places where input costs, product mix, and pricing power become visible. Operating margin adds the effect of selling, administrative, research, labor, and overhead costs. Net margin adds financing costs, taxes, and non-operating items, which can make the final figure more complete but sometimes less clean as a core operating signal.
How Profit Margins Connect to the Earnings Cycle
Profit margins matter for the earnings cycle because earnings depend on both revenue and the share of revenue that turns into profit. Revenue can keep growing while profits slow if costs rise faster, pricing power weakens, or operating expenses absorb the gain.
Mechanism: Revenue conditions, cost pressure, pricing power, product mix, operating leverage, financing costs, and tax effects flow into gross, operating, or net margins. Margin changes then affect earnings sensitivity and can influence how markets interpret the durability of the profit cycle.
Margin expansion can support earnings when revenue growth is stable and costs are contained. Margin compression can pressure earnings when costs, wages, input prices, discounts, financing costs, or weaker mix absorb revenue gains. The interpretation becomes more useful when the margin trend is consistent across several reporting periods or appears across a sector rather than in one isolated company.
Margin data also helps separate nominal growth from real profitability. During periods of inflation or changing demand, sales can rise because prices are higher, but margins may still narrow if cost pressure moves faster than pricing power.
Observable Signals and Measurement Context
Profit margins are more useful when they are read with surrounding conditions. A single percentage can be misleading, but the pattern across revenue, costs, margin layers, and expectations can clarify the earnings environment.
| Observation | Possible interpretation | Important limitation |
|---|---|---|
| Revenue rises while margins expand | Demand, pricing, mix, or scale may be supporting earnings quality | One-time gains or temporary cost relief can overstate durability |
| Revenue rises while margins compress | Cost pressure, weaker pricing power, unfavorable mix, or operating leverage pressure may be absorbing growth | The pressure may be temporary, sector-specific, or accounting-related |
| Gross margin weakens before operating margin | Input costs, pricing pressure, or product mix may be the first pressure point | Later operating discipline can partially offset the initial pressure |
| Operating margin weakens while gross margin holds | Labor, overhead, selling, administrative, or research costs may be pressuring profitability | Growth investment can depress margins without signaling immediate weakness |
| Net margin weakens more than operating margin | Interest costs, taxes, non-operating losses, or financing structure may be affecting final earnings | Core operating profitability may still be more stable than net income suggests |
Sector context matters. Software, retail, industrials, banks, commodity producers, and utilities can have very different normal margin structures. A high margin in one industry may be normal, while a lower margin in another industry may still be structurally healthy for that business model.
Profit Margins, Margin Compression, and Inflation Pressure
Margin pressure becomes more specific when revenue growth is not turning into stronger profitability. If costs rise faster than sales, discounts increase, product mix weakens, or operating expenses grow faster than revenue, margin compression becomes the more precise pressure mechanism.
Inflation can affect margins through several channels. Input costs, wages, freight, financing costs, inventory costs, and demand sensitivity can all change the relationship between revenue and profit. Profit margins and inflation become especially connected when companies cannot fully pass higher costs through to customers without weakening demand.
Illustrative scenario: A sector reports higher revenue because selling prices increased, but gross margin narrows as input costs rise faster than those prices. Operating margin also weakens because labor and distribution costs increase. Revenue growth is visible, but the earnings cycle is less strong than the sales number suggests.
This type of scenario does not automatically imply recession, market direction, or a trade decision. It shows why margin layers are useful: they help identify where the pressure is entering the earnings chain.
When Profit Margins Can Mislead
Profit margins can look precise while still giving an incomplete signal. The main risk is treating a ratio as a complete explanation of business strength, sector health, or market direction.
Common limitation: High margins are not automatically durable, and falling margins are not automatically recessionary. Margin interpretation depends on sector norms, revenue growth, cost structure, accounting classification, one-time items, financing costs, and where the economy sits in the profit cycle.
A high margin can reflect strong pricing power, but it can also invite competition, depend on a narrow product mix, or be lifted by temporary cost advantages. A low margin can signal pressure, but it can also be normal in high-volume industries where scale, inventory turnover, or capital structure matter more than the margin percentage alone.
One-time items can distort net margin. Restructuring charges, tax effects, asset sales, legal costs, impairments, and non-operating gains can move net income without fully describing the underlying operating trend. For that reason, gross and operating margins often provide cleaner clues about the source of pressure before net margin is interpreted.
Another common mistake is comparing margins across unrelated industries. The stronger comparison is usually a company or sector against its own history, its direct peers, and the current cost and demand environment.
Profit Margins and Earnings Revisions
Profit margin trends can affect expectations when analysts, investors, or market participants reassess future earnings. Sustained margin pressure may lower expected earnings even when revenue assumptions remain stable, while sustained margin improvement can support stronger earnings expectations if the improvement appears durable.
This connection is not mechanical. Markets may already expect margin pressure, and a weak margin print may matter less if it was already reflected in forecasts. The link becomes more meaningful when margin changes force changes in future earnings assumptions, which is where earnings revisions enter the interpretation.
For broad market structure, profit margins are best treated as part of an evidence stack. They can support an earnings-cycle view, but they should be compared with revenue trends, cost pressure, credit conditions, financing costs, sector leadership, and changes in expectations.
Related Profitability Concepts
Profit margins define the baseline profitability ratio. Narrowing margins describe the pressure mechanism, inflation adds a specific cost and pricing channel, and earnings revisions describe how expectations can change after margin trends shift.
| Concept | Use when the question is about | Relationship to profit margins |
|---|---|---|
| Margin compression | Narrowing profitability despite revenue, pricing, or demand changes | Explains the pressure mechanism after margins begin to shrink |
| Profit margins and inflation | Cost pass-through, input costs, pricing power, and demand sensitivity | Explains how inflation can change margin quality |
| Earnings revisions | Changing expectations for future earnings | Explains how margin trends can affect forecast changes |
FAQ
What is the difference between gross, operating, and net profit margin?
Gross margin measures profit after direct costs, operating margin measures profit after core operating expenses, and net margin measures final profit after financing costs, taxes, and non-operating items.
Are high profit margins always good?
High profit margins can indicate pricing power or efficiency, but they are not automatically durable. Sector structure, competition, one-time items, cost pressure, and revenue growth all affect the interpretation.
Do falling profit margins predict market direction?
Falling profit margins can signal earnings pressure, but they do not predict market direction by themselves. The reading depends on expectations, sector context, credit conditions, revenue trends, and whether the pressure is temporary or persistent.