
Margin compression is the narrowing of profitability when costs, expenses, financing costs, discounting, weaker pricing power, demand pressure, or mix shifts reduce the margin between revenue and profit.
For earnings-cycle interpretation, margin compression shows how much revenue is being absorbed before it reaches gross profit, operating profit, or net income. It can signal profitability pressure, but it does not by itself prove falling revenue, recession, stock-market direction, or a market timing signal.
Definition: Margin compression occurs when a company, sector, or earnings group keeps less profit from each unit of revenue than before. The pressure can come from higher input costs, wages, freight, interest expense, discounts, weaker pricing power, unfavorable mix, or fixed costs that become heavier when revenue growth slows.
Key Points
- Margin compression means profit margins are narrowing, not necessarily that revenue is falling.
- The pressure can appear in gross margin, operating margin, net margin, or several layers at once.
- Pricing power matters because companies with stronger pricing power may offset some cost pressure, while weaker pricing power can leave more pressure in margins.
- Margin compression becomes more important when it appears alongside weaker demand, discounting, operating leverage sensitivity, or earnings estimate pressure.
- It is a profitability signal, not a standalone recession call, stock signal, or complete market view.
What Margin Compression Means
Margin compression describes a thinner gap between revenue and profit. Revenue can be stable or even rising, while the profit kept from that revenue declines because costs, discounts, financing expense, or operating expenses absorb more of the sales base.
Margin pressure is the broader condition. Margin compression is the observed narrowing of the margin itself. A company or sector may face margin pressure before the reported margin has compressed, especially when investors expect cost pressure, weaker pricing power, or demand softness to show up in future earnings.
The concept is most useful when the specific margin layer is clear. Gross margin compression, operating margin compression, and net margin compression can point to different pressure channels.
How Margin Compression Works
Margin compression usually develops through a chain rather than a single cause. Costs may rise, pricing power may weaken, customers may trade down, discounts may increase, or fixed costs may absorb more revenue when growth slows. The same final result can come from different combinations of pressure.
| Driver | Margin channel | Earnings-cycle interpretation | Limitation |
|---|---|---|---|
| Input cost pressure | Gross margin can narrow if materials, energy, freight, or supplier costs rise faster than selling prices. | Profitability may become more sensitive to pricing power and cost pass-through. | Cost pressure alone does not prove demand weakness. |
| Wage and operating expense growth | Operating margin can narrow when payroll, rent, technology, or administrative costs rise faster than revenue. | Operating profit may weaken even when gross profit remains more stable. | Some expenses may be temporary, investment-related, or timing-related. |
| Weaker pricing power | Margins can narrow if companies cannot raise prices enough to offset higher costs. | Pricing power becomes a key test of earnings durability. | Weak pricing power may be sector-specific rather than economy-wide. |
| Demand softness and discounting | Gross and operating margins can compress when sales require heavier promotions or lower realized prices. | Discounting can show that revenue quality is weaker than headline sales suggest. | Discounting may clear inventory without becoming a persistent trend. |
| Financing cost pressure | Net margin can narrow when higher interest expense reduces profit after operating income. | Balance-sheet sensitivity can matter more when rates or refinancing costs rise. | Net margin pressure should not be confused with operating weakness unless operating margins also deteriorate. |
| Operating leverage | Fixed costs become heavier when revenue growth slows or unit volumes weaken. | Earnings can become more sensitive to small changes in revenue, volume, or utilization. | High fixed-cost sensitivity can amplify both improvement and deterioration. |
| Revenue mix shift | Margins can narrow if lower-margin products, services, customers, or regions become a larger share of sales. | Headline revenue growth may hide weaker profit quality. | Mix effects require category detail before drawing broad conclusions. |
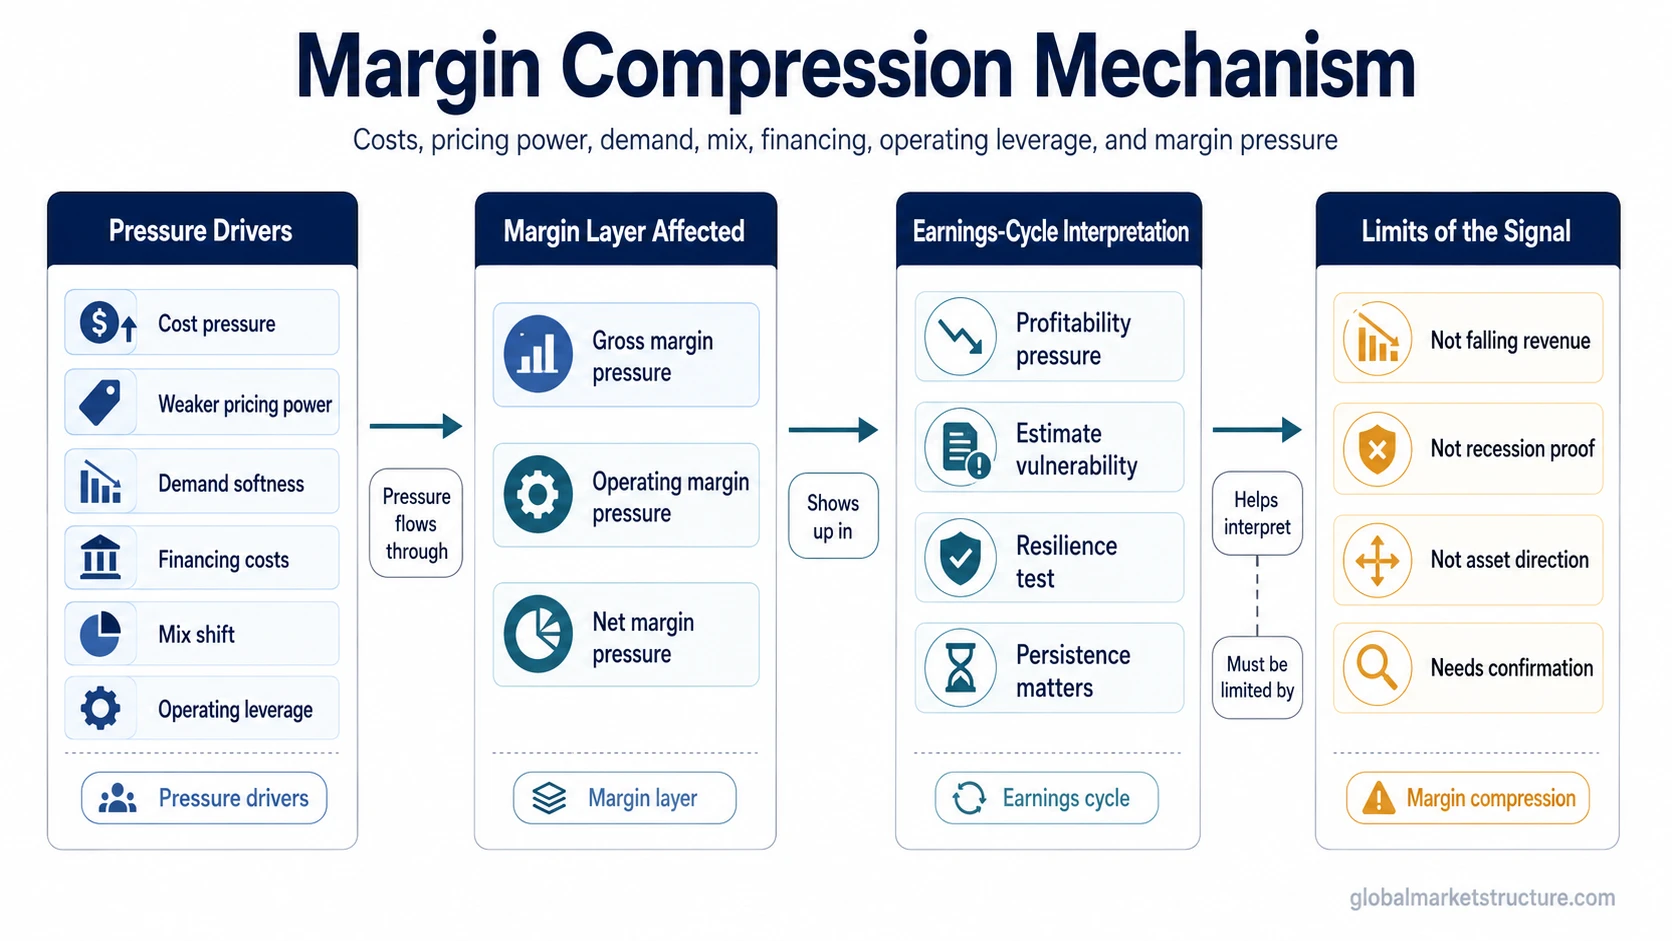
Stronger reading: Margin compression carries more weight when it persists across reporting periods, appears across related companies, and aligns with weaker pricing power, discounting, softer demand, or more cautious earnings expectations.
Weaker reading: A single-period margin decline is less informative when it reflects temporary input costs, inventory timing, one-off expenses, or a mix shift that is not visible across the broader earnings group.
Gross, Operating, and Net Margin Compression
Margin compression is more precise when the affected margin layer is named. Gross margin compression points closer to production cost, input cost, freight, product mix, and pricing power. Operating margin compression adds the effect of wages, rent, technology, sales expense, and other operating costs. Net margin compression can include tax, interest, financing, and non-operating items.
Profit margins provide the measurement base for separating these layers. Without that separation, margin compression can become too vague because the same headline phrase may describe very different earnings pressures.
A banking context can use net interest margin language, but that is a sector-specific form rather than the default meaning of margin compression. A healthcare, retail, industrial, or software context may involve different drivers, so industry-specific evidence should not be generalized without source support.
Margin Compression in the Earnings Cycle
In an earnings cycle, margin compression can be an early profitability warning when sales growth still looks acceptable but each dollar of revenue produces less profit. The pressure becomes more relevant when it appears across several companies, sectors, or reporting periods rather than in one isolated report.
Margin compression can make future earnings estimates more vulnerable when analysts expect cost pressure, discounting, weaker pricing power, or financing expense to persist. The link is conditional because estimates also depend on revenue assumptions, company guidance, sector conditions, and broader demand evidence.
The timing problem is important. Margins can compress before revenue slows, during a slowdown, or after temporary cost shocks. A narrow margin move does not identify the stage of the cycle on its own. It needs confirmation from revenue quality, pricing power, operating leverage, revisions, demand indicators, and broader macro context.
Operating Leverage and Margin Compression
Operating leverage explains why margin compression can become more severe when fixed costs are high. If a business or sector carries meaningful fixed expenses, a modest slowdown in revenue growth can reduce operating margin more sharply than the revenue change alone would suggest.
This does not mean high operating leverage is always negative. The same structure can amplify earnings improvement when revenue growth strengthens. The risk appears when fixed costs remain in place while volume, price, or utilization weakens.
For market-structure interpretation, the operating leverage link helps separate simple cost pressure from earnings sensitivity. A low-margin business with high fixed costs may react differently from a high-margin business with flexible costs, even if both report margin compression.
Margin Compression Example in Context
A company or sector can report higher revenue while margins narrow. Sales may rise because prices are higher or volumes are still stable, but input costs, wages, freight, interest expense, discounts, or a shift toward lower-margin products may absorb more of the revenue gain.
In that scenario, the first observation is not that earnings must fall immediately. The cleaner interpretation is that each dollar of revenue is producing less profit than before. The pressure becomes more important if the pattern continues, spreads across related businesses, or appears alongside weaker pricing power and more cautious earnings expectations.
What Margin Compression Does Not Prove
Margin compression does not prove falling revenue. Revenue can grow while margins narrow if costs, discounts, mix, or financing expenses absorb more of the sales base.
Margin compression does not confirm recession. It can be one earnings-cycle pressure point, but recession analysis requires broader evidence across growth, labor, credit, income, production, policy, and market behavior.
Margin compression does not predict asset direction by itself. Markets may already price in the pressure, overlook it temporarily, or respond differently depending on liquidity, valuation, positioning, rates, and forward expectations.
Margin compression is not the same across sectors. A banking margin issue, a healthcare margin issue, and a retail discounting issue may share the same label while reflecting different economics.
How to Interpret Margin Compression Without Overreading It
A cleaner interpretation starts with the margin layer, then moves to the driver. Gross margin pressure points toward cost of goods, input prices, pricing power, or mix. Operating margin pressure adds fixed costs and overhead. Net margin pressure can include financing cost, tax, and non-operating effects.
The next test is persistence. One quarter of compression may reflect timing, inventory, temporary cost shifts, or one-off items. Repeated compression across reporting periods or related companies carries more weight, especially when management commentary, analyst estimates, and demand indicators move in the same direction.
The final test is context. Margin compression is more informative when combined with earnings revisions, profit margin trends, revenue quality, pricing power, credit conditions, and broader risk appetite. It is weaker when isolated from the rest of the earnings and macro picture.
Related Profitability Concepts
Margin compression sits between measurement and interpretation. Profit margin categories show where the narrowing appears, while fixed-cost sensitivity explains why a small revenue change can create a larger earnings effect.
- Use profit margin analysis to identify whether the pressure is gross, operating, or net.
- Use operating leverage analysis to judge whether fixed costs may amplify the earnings effect.
- Use earnings-cycle context to avoid treating one margin reading as a complete market signal.
FAQ
Does margin compression mean revenue is falling?
No. Revenue can rise while margins compress if costs, discounts, financing expense, wages, or mix effects absorb more of the revenue base.
Is margin compression the same as margin pressure?
Margin pressure is the broader condition that can threaten profitability. Margin compression is the actual narrowing of the profit margin after that pressure shows up in the numbers.
Is margin compression a recession signal?
Not by itself. It can contribute to earnings-cycle pressure, but recession interpretation requires broader evidence across growth, credit, labor, policy, income, production, and market conditions.