
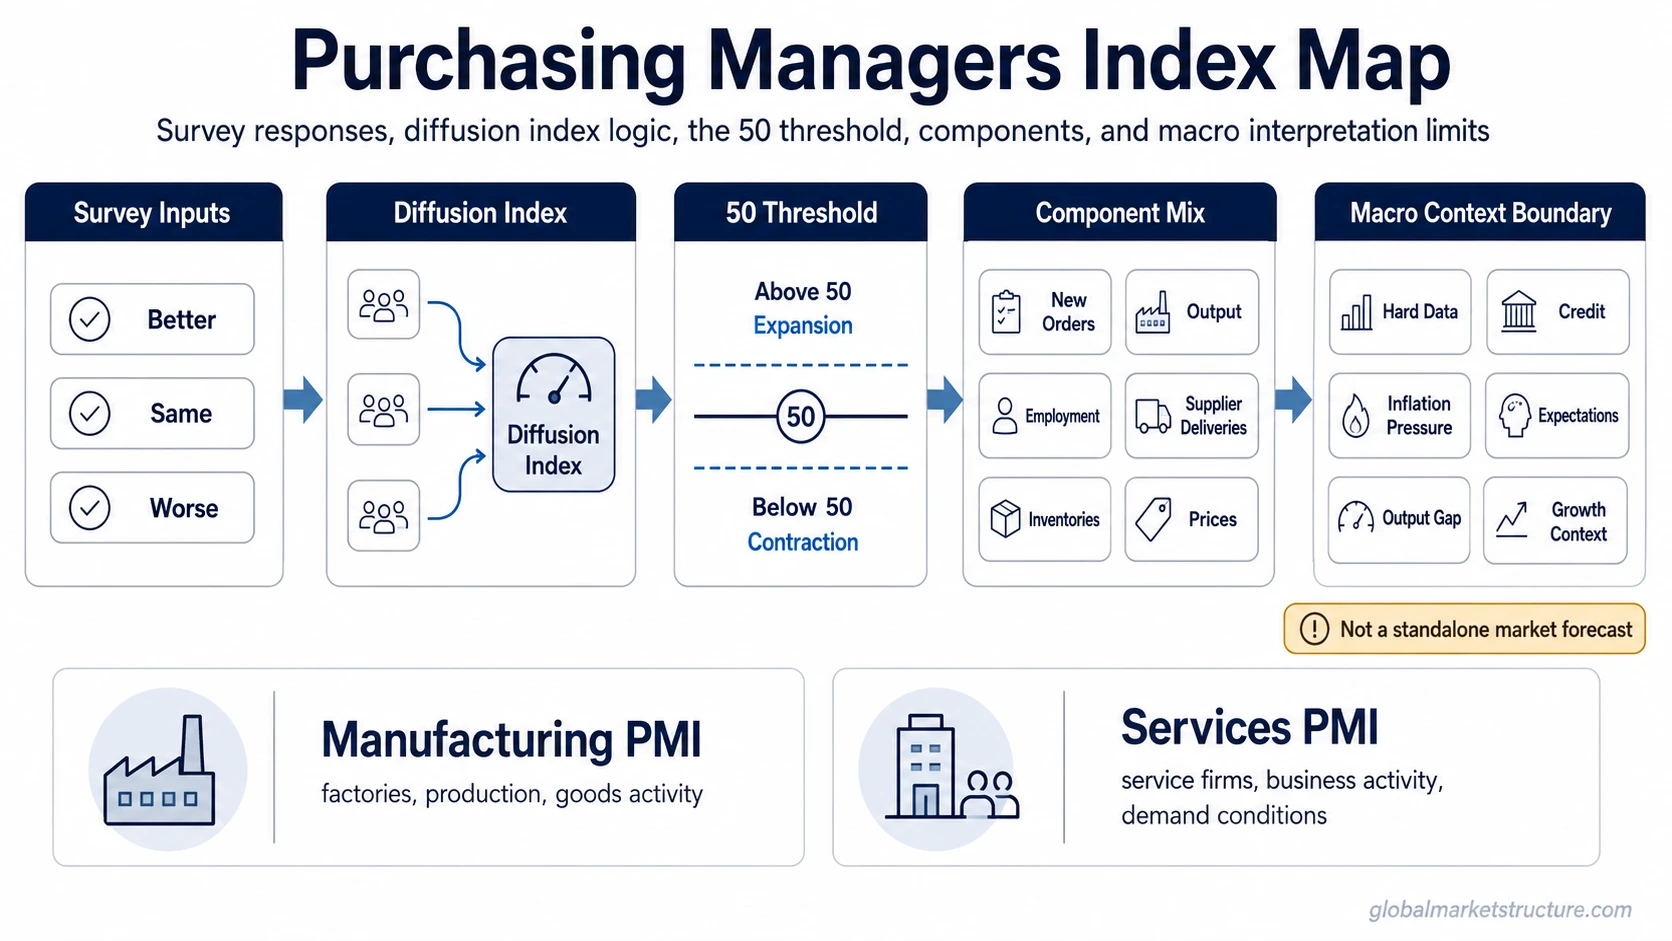
Purchasing Managers Index is a survey-based economic indicator that tracks whether business activity is expanding or contracting across areas such as new orders, output, employment, supplier deliveries, inventories, and prices. A reading above 50 generally indicates expansion in the surveyed activity universe, while below 50 generally indicates contraction. PMI is timely, but it is not a standalone market forecast.
For market interpretation, PMI is most useful as a soft-data signal of activity momentum. It can show whether business conditions are improving or weakening before some slower hard data is released, but the reading still needs context from trend, components, expectations, price pressure, labor conditions, credit, and broader growth indicators.
What Is the Purchasing Managers Index?
The Purchasing Managers Index, usually shortened to PMI, summarizes survey responses from purchasing managers and other business respondents into a diffusion-style index. The index is designed to show whether activity across a surveyed business universe is expanding, contracting, or staying close to neutral.
PMI is called a soft economic indicator because it comes from surveys rather than directly measured output, sales, production, or employment records. That does not make it useless. It means PMI should be read as a timely activity signal, not as final proof of actual economic output.
Key Points
- PMI measures survey-based business activity momentum.
- A reading above 50 generally points to expansion in the surveyed sector, while below 50 generally points to contraction.
- Components such as new orders, output, employment, supplier deliveries, inventories, and prices help explain what is driving the headline reading.
- Manufacturing PMI and services PMI can tell different stories because they survey different parts of the economy.
- PMI should not be treated as a direct recession call, asset-price forecast, or trading signal.
How PMI Is Measured
PMI is built from survey answers about whether conditions improved, worsened, or stayed unchanged versus the prior survey period. Those answers are converted into a diffusion index. A diffusion index focuses on the breadth of improvement or deterioration, not the exact size of every change.
This distinction matters. PMI does not measure the exact dollar value of output or the exact number of workers hired. It measures whether more surveyed firms report better conditions, weaker conditions, or no change. The result is a timely directional reading of business activity breadth.
PMI is soft data because it comes from survey responses. Hard data, such as industrial production, retail sales, employment reports, or GDP, measures recorded economic activity more directly. PMI can move earlier, but hard data is still needed to confirm whether the survey signal is visible in measured activity.
Different PMI providers and national survey systems may use different samples, sector coverage, question wording, seasonal adjustment methods, and component structures. The most precise methodology details belong in the relevant source report, especially when comparing series across providers or countries.
Who Publishes PMI Data?
PMI data can come from official survey organizations, national sources, and private data providers. The headline concept is similar across many PMI series, but source coverage, survey universe, sector scope, and methodology can differ. For current readings or provider-specific details, the original source report remains the correct reference point.
What PMI Components Measure
The headline PMI number is useful, but the component mix often carries more interpretation value than the headline alone. A stable headline can hide weaker new orders, stronger supplier-delivery effects, or price pressure that changes the macro reading.
| PMI area | What it helps indicate | Interpretation boundary |
|---|---|---|
| New orders | Demand momentum and future activity pressure | New orders can weaken before output adjusts, but one reading does not confirm a full cycle turn. |
| Output or production | Current activity inside the surveyed sector | Surveyed output is not the same as official GDP or industrial production data. |
| Employment | Labor demand inside surveyed firms | Employment survey responses should be read with broader labor-market data. |
| Supplier deliveries | Supply-chain timing, bottlenecks, or delivery stress | Longer delivery times can reflect strong demand or supply disruption, so context matters. |
| Inventories | Stock-building, drawdowns, or demand planning | Inventory changes can reflect caution, normalization, or demand misjudgment. |
| Prices | Input-cost pressure or selling-price pressure | Price components can signal pressure, but they do not alone define the inflation path. |
A strong PMI interpretation looks beyond the headline. For example, an improving headline with weak new orders and falling employment can carry a different message from an improving headline led by demand, output, and hiring.
What Above 50 and Below 50 Mean
The 50 level is the common neutral line. A PMI reading above 50 generally indicates that activity is expanding across the surveyed universe. A reading below 50 generally indicates that activity is contracting. A reading near 50 suggests conditions are close to flat.
The level is only one part of the interpretation. Direction also matters. A PMI reading that rises from deeply below 50 to just below 50 may suggest that contraction is becoming less broad, not that activity has already returned to expansion. A reading that falls while still above 50 may suggest slower expansion, not immediate contraction.
Common False Reading
A PMI improvement below 50 does not automatically mean the surveyed economy is expanding. It may only mean that contraction is becoming less severe or less widespread. The interpretation changes when new orders, output, employment, prices, and expectations point in different directions.
Manufacturing PMI vs Services PMI
Manufacturing PMI and services PMI both use survey logic, but they describe different activity universes. Manufacturing PMI focuses on goods-producing activity, supply chains, orders, inventories, and production conditions. Services PMI focuses on service-sector activity, demand, employment, and price pressure in service industries.
| PMI type | Main activity universe | Why it matters | What not to assume |
|---|---|---|---|
| Manufacturing PMI | Factories, goods production, orders, supply chains, inventories | Useful for reading goods-cycle momentum and supply-chain pressure | It does not always represent the full economy, especially where services dominate output. |
| Services PMI | Service-sector demand, business activity, employment, pricing pressure | Useful for reading service-economy momentum and labor-linked activity | It does not replace manufacturing data, goods demand, or hard economic releases. |
| Composite PMI | A combined view of manufacturing and services where available | Useful for a broader activity snapshot | It can still hide divergence between goods and services. |
No PMI type is automatically more important in every environment. The more useful question is which sector is driving the current change, whether the move is broad or narrow, and whether the component mix supports the headline.
Why PMI Is Watched as a Growth Signal
PMI is watched because it is timely, directional, and tied to business conditions. It can help investors and analysts see whether activity momentum is improving or weakening before slower official releases fully reflect the change.
That timeliness is also the reason PMI should be handled carefully. A survey can move faster than hard data, but it can also react to temporary sentiment, supply-chain disruptions, seasonal effects, or short-lived demand shifts. PMI is useful as an early read, not as final proof.
PMI becomes more meaningful when it is compared with broader growth and capacity context, including the output gap. A PMI expansion signal can mean something different when the economy has slack than when capacity pressure is already high.
PMI, Expectations, and Market Interpretation
Markets do not respond only to whether PMI is above or below 50. They also respond to whether the reading was stronger or weaker than expected, whether the direction changed, and whether components support the headline.
A weak PMI reading may already be expected. A modest improvement may matter more if expectations were very low. A strong headline can still be questioned if new orders weaken, employment softens, or price pressure rises in a way that complicates policy interpretation.
This is where PMI connects to the Economic Surprise Index. PMI helps describe activity momentum, while surprise data helps show whether incoming data is beating or missing the consensus path. The two can overlap, but they do not answer the same question.
PMI and Broader Macro Context
PMI is most useful when it sits inside a broader macro dashboard. Growth momentum, labor demand, inflation pressure, output gap, credit conditions, policy expectations, and market breadth can all change the interpretation of a PMI move.
For a broader multi-indicator approach, PMI belongs inside a growth nowcasting framework rather than being treated as a complete regime model by itself.
Example Scenario
A PMI headline can improve while remaining below 50. That can suggest that contraction is becoming less broad, but the macro reading is stronger only if new orders, output, employment, price pressure, and hard data begin to support the same direction. Without that confirmation, the survey improvement remains an early signal rather than a completed growth turn.
Limitations of PMI
PMI has several important limits. It is a survey, not a full measure of output. It reflects breadth, not the exact size of every change. It can differ by provider, country, sector, sample, and methodology. It can also be affected by sentiment, supply disruptions, and temporary shocks.
The main mistake is turning PMI into a single macro verdict. A reading above 50 does not automatically mean the full economy is strong. A reading below 50 does not automatically mean recession. A strong price component does not automatically define the inflation path. A single release should not replace trend and cross-checking.
Interpretation Boundary
PMI is a useful macro input, not a complete decision system. It should be read alongside hard data, expectations, credit conditions, policy context, inflation indicators, labor data, and other growth measures before drawing broader conclusions.
FAQ
What does PMI mean?
PMI means Purchasing Managers Index. It is a survey-based indicator that summarizes whether business activity in a surveyed sector is generally expanding, contracting, or close to unchanged.
What does a PMI reading above 50 mean?
A reading above 50 generally indicates expansion in the surveyed activity universe. The interpretation still depends on trend, components, sector coverage, and whether the result matched expectations.
What does a PMI reading below 50 mean?
A reading below 50 generally indicates contraction in the surveyed activity universe. It does not automatically mean recession, because one survey reading is not enough to define the whole economy.
Is PMI a leading indicator?
PMI is often treated as a timely or leading activity indicator because survey data can reflect changing business conditions before some official hard data is released. It should still be confirmed against broader data.
Is PMI a stock market signal?
No. PMI can affect market interpretation because it relates to growth momentum, but it is not a buy signal, sell signal, recession guarantee, or direct asset-price forecast.