
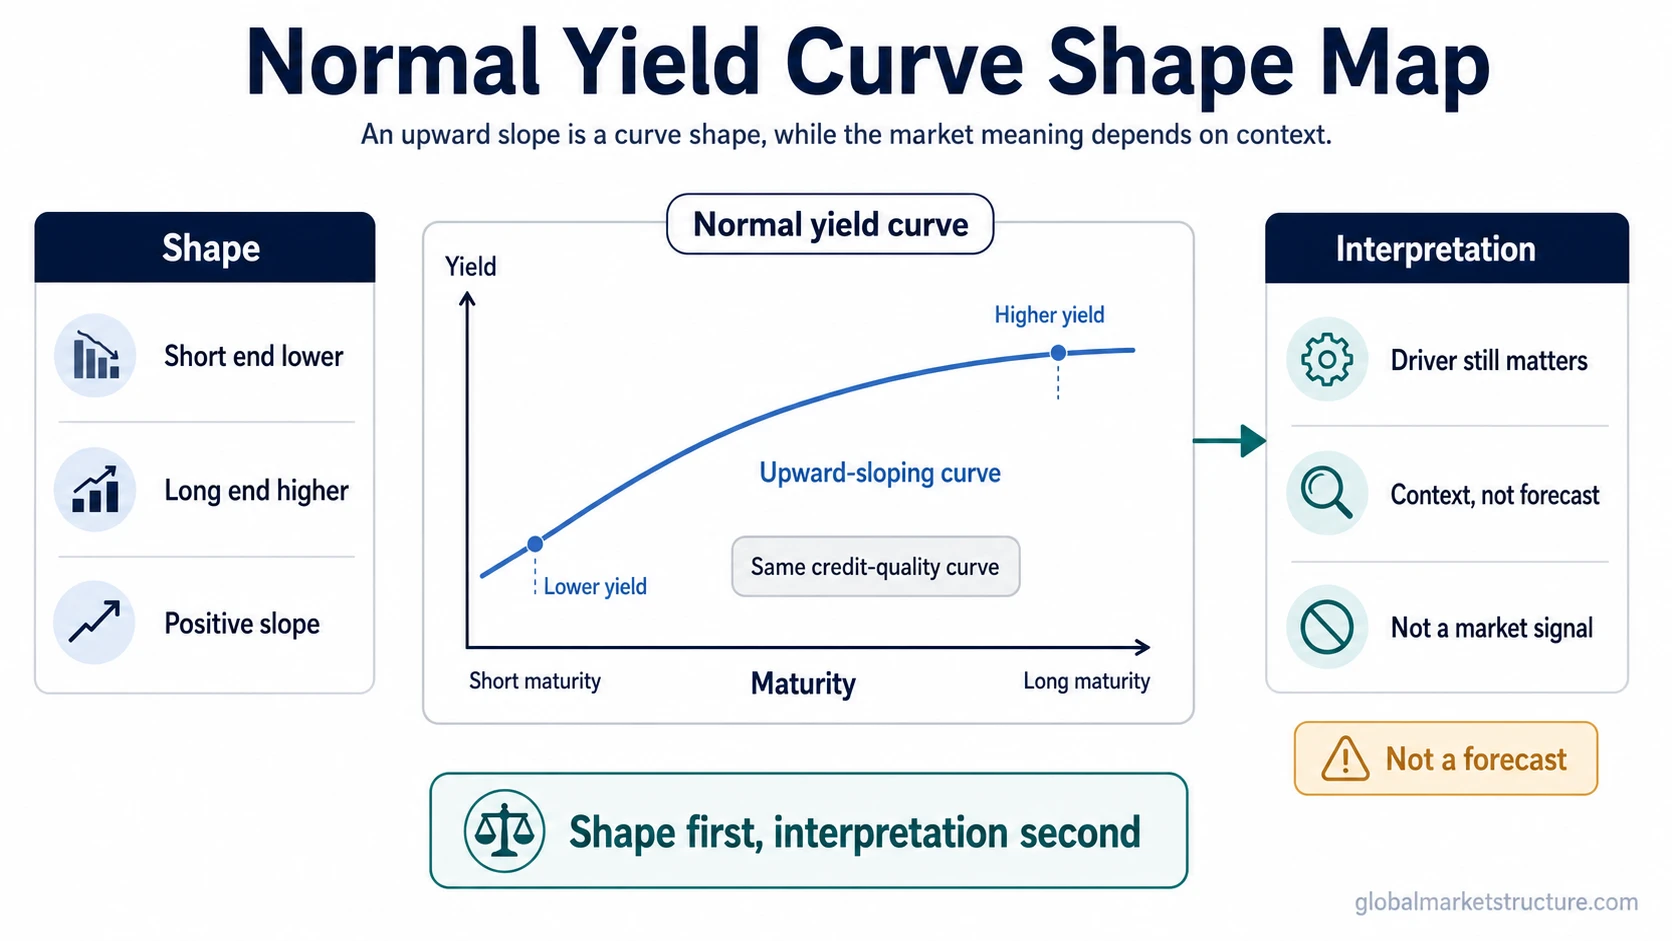
A normal yield curve is an upward-sloping yield curve where longer-maturity bonds usually offer higher yields than shorter-maturity bonds within the same credit-quality curve.
Normal yield curve: a curve shape in which short-term yields are lower than long-term yields. The word “normal” describes the slope of the curve, not a guaranteed economic outcome.
The comparison matters only when the maturities belong to the same broad curve and credit-quality category. Comparing a short-term government yield with a long-term corporate yield would mix maturity risk with credit risk. A clean normal-curve reading compares maturities across a consistent yield curve.
What a Normal Yield Curve Means
A normal yield curve slopes upward from shorter maturities to longer maturities. The short end of the curve reflects yields on near-term maturities, while the long end reflects yields on bonds that mature further in the future.
The basic structure is simple: investors usually demand more yield for lending money over a longer period. Longer maturities expose the holder to more time, more interest-rate uncertainty, more inflation uncertainty, and more duration sensitivity.
| What you observe | Structural meaning | What it does not prove |
|---|---|---|
| Longer maturities yield more than shorter maturities | The curve has a positive slope | Growth is guaranteed |
| Short-term rates sit below long-term rates | Markets are pricing a term structure with higher compensation further out | Risk assets must rise |
| The curve is not flat or inverted | The term spread is still positive | Recession risk has disappeared |
Why the Curve Often Slopes Upward
A normal curve often reflects compensation for time and uncertainty. The longer the maturity, the more time there is for inflation, policy rates, growth expectations, and market conditions to change.
Duration also matters. Longer-maturity bonds are usually more sensitive to changes in yields. When yields move, long-duration bonds tend to experience larger price changes than short-duration bonds. Higher long-term yields can compensate for that added sensitivity.
Term premium can also contribute to the upward slope. Term premium is the extra yield investors may require for holding longer-term debt instead of rolling shorter-term instruments over time. That premium can rise or fall depending on inflation uncertainty, supply and demand for bonds, central-bank policy expectations, liquidity conditions, and investor risk appetite.
What a Normal Yield Curve Can Suggest
A normal yield curve can suggest that markets are not pricing the same immediate stress that appears in a deeply inverted curve. It can be consistent with ordinary positive term-spread conditions, where longer maturities carry higher yields because the future is uncertain and time compensation matters.
The interpretation still depends on the driver. A positive slope can appear because long-term yields are rising, short-term yields are falling, or both. Those cases can carry different macro meanings. A curve can look normal while inflation expectations, real yields, credit spreads, or liquidity conditions are sending a more cautious message.
Interpretation rule: shape comes first, macro meaning comes second. A positive slope identifies the curve structure. It does not, by itself, explain why the structure exists.
What a Normal Yield Curve Does Not Prove
Normal does not mean automatically healthy. It does not prove that growth is strong, recession risk is low, policy risk is gone, or risk assets should perform well. It only says that longer maturities are yielding more than shorter maturities inside the curve being compared.
The same upward slope can have different causes. If the long end rises because inflation uncertainty increases, the market message may differ from a curve that normalizes because short-term yields fall after policy expectations change. Without the driver, the slope is incomplete evidence.
Limit: a normal yield curve is context, not a forecast. Live spread levels, Treasury yields, inflation data, policy expectations, and recession probabilities change over time, so they need dated data rather than a static curve-shape label.
Normal vs Flat, Inverted, and Steep Yield Curves
Normal, flat, inverted, and steep curves describe different slope conditions. The labels are related, but they are not interchangeable.
| Curve shape | Basic structure | Interpretation boundary |
|---|---|---|
| Normal yield curve | Longer maturities usually yield more than shorter maturities | Positive slope, but not a guaranteed growth signal |
| Flat yield curve | Short-term and long-term yields are close together | Can signal transition, uncertainty, or compressed term compensation |
| Inverted yield curve | Short-term yields are higher than longer-term yields | Often treated as a stress or cycle-warning shape, but still needs context |
| Steep yield curve | Long-term yields are much higher than short-term yields | Can reflect stronger term premium, inflation expectations, policy shifts, or growth expectations |
The clearest contrast is between a normal curve and a yield curve inversion. The normal vs inverted yield curve distinction separates positive slope from negative slope directly.
Simple Scenario
Imagine a government bond curve where the 2-year yield is lower than the 10-year yield. The curve slopes upward because investors receive more yield for holding the longer maturity. That is a normal curve shape.
The same observation does not explain everything. If the 10-year yield is rising because inflation uncertainty is increasing, the macro message is different from a case where the 2-year yield is falling because markets expect easier policy later. The shape is visible, but the reason behind the shape still needs interpretation.
Common Misread
Common misread: treating a normal curve as a green light for the economy or markets.
A positive slope can be part of a stable market backdrop, but it is not enough on its own. Real yields, credit spreads, liquidity conditions, inflation expectations, and curve movement all change the interpretation.
The cleaner reading is to treat the normal curve as one rates-structure input, then compare it with credit, liquidity, inflation expectations, and curve movement before drawing a broader market conclusion.
FAQ
Does a normal yield curve mean the economy is healthy?
No. A normal curve describes a positive slope. It can be consistent with ordinary conditions, but it does not prove growth is strong, recession risk is gone, or markets are safe.
Is a steep yield curve the same as a normal yield curve?
No. A steep curve is also upward sloping, but the gap between short-term and long-term yields is larger. The reason for the steepness still matters.
Can a normal yield curve still be misleading?
Yes. A normal curve can be misleading if the slope is read without inflation, policy, credit, liquidity, and term-premium context.