
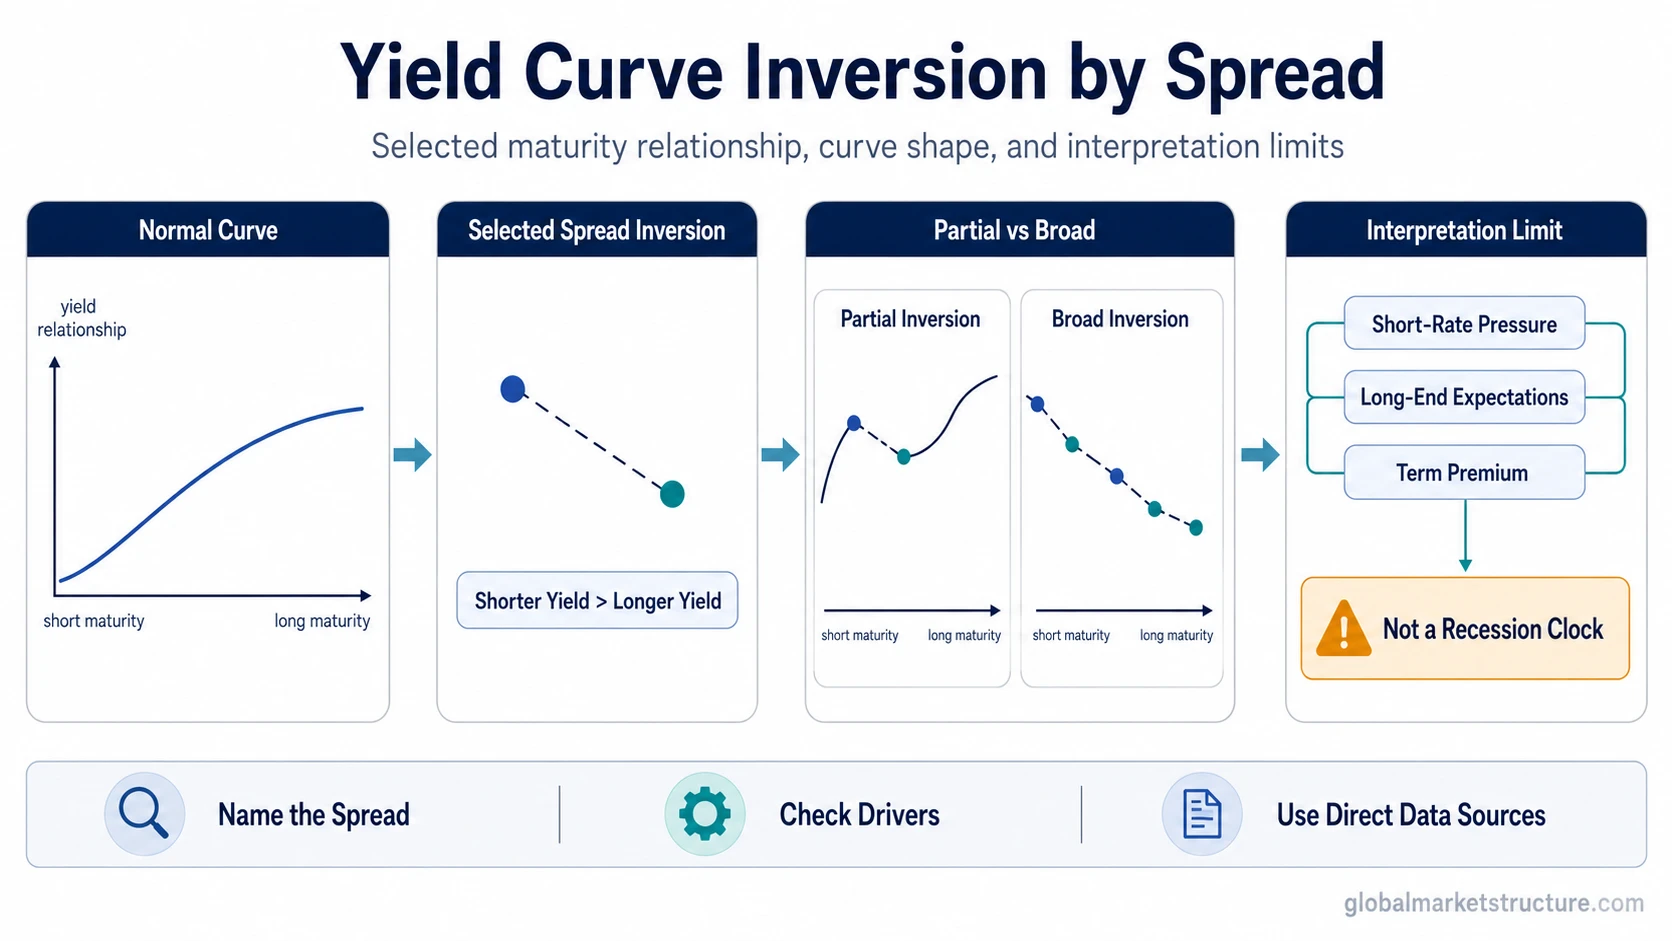
A yield curve inversion occurs when a shorter-maturity yield is higher than a longer-maturity yield for a selected maturity spread, such as 10Y-2Y or 10Y-3M. The signal depends on which maturities are compared. It is not a universal statement that the entire curve is inverted, and it is not a deterministic recession clock.
Definition: Yield curve inversion means that a selected short maturity yield sits above a selected longer maturity yield. The inversion is measured through a spread or curve segment, not through a single yield level. It can help describe pressure inside the rates structure, but it does not prove recession timing, asset direction, or a portfolio action.
For macro interpretation, the first question is not only whether an inversion exists. The first question is which part of the yield curve is inverted and what is driving the short end and the long end at the same time.
Key Points
- Yield curve inversion is spread-specific: one part of the curve can invert while other parts do not.
- Common references include 10Y-2Y and 10Y-3M, but those spreads are not identical signals.
- An inversion can reflect restrictive policy expectations, weaker growth expectations, safe-asset demand, lower inflation expectations, or changes in term premium.
- The signal is often watched in recession-risk analysis, but it does not provide a precise recession date, market direction, or trade instruction.
- Current spread levels and official model probabilities should be checked from direct data or model sources, not inferred from a general educational definition.
Why The Maturity Spread Matters
A yield curve is made from many maturities. A two-year yield, three-month yield, five-year yield, ten-year yield, and thirty-year yield can move differently because they reflect different time horizons and different investor expectations. That is why the phrase “inverted yield curve” is incomplete unless the relevant spread is named.
| Spread or curve segment | What it compares | What it can indicate | Key limitation |
|---|---|---|---|
| 10Y-2Y | Ten-year yield versus two-year yield | How intermediate policy expectations and long-term growth or inflation expectations are priced against each other | It does not show the whole curve and should not be treated as identical to 10Y-3M |
| 10Y-3M | Ten-year yield versus three-month yield | How the very front end of rates compares with the long end | It can behave differently from 10Y-2Y because the three-month yield is closer to current policy-rate conditions |
| Front-end spread | Shorter maturities near the policy-sensitive part of the curve | Pressure from central-bank policy expectations, money-market conditions, or near-term rate pricing | It may say more about near-term policy pressure than about the whole long-term macro outlook |
| Partial inversion | One selected spread or one section of the curve | A localized inversion in a specific maturity relationship | It should not be described as the entire yield curve being inverted |
| Broad curve inversion | Multiple curve segments where shorter maturities sit above longer maturities | A wider inversion pattern across the maturity structure | Even broad inversion still requires context from growth, inflation, liquidity, credit, and policy expectations |
A normal yield curve usually refers to an upward-sloping relationship where longer maturities yield more than shorter maturities. Inversion is the opposite relationship for the selected spread, but the interpretation still depends on why that relationship changed.
How A Yield Curve Inversion Can Happen
Inversion can develop through pressure at the short end, movement at the long end, or both. The short end is often more sensitive to current monetary policy and near-term policy-rate expectations. The long end can reflect expected growth, expected inflation, safe-asset demand, and compensation for holding longer maturities.
Mechanism sequence:
- Short-maturity yields rise or stay elevated because policy expectations remain restrictive.
- Longer-maturity yields fall, stay lower, or rise less because markets price weaker future growth, lower future inflation, stronger safe-asset demand, or a lower long-end risk premium.
- The selected shorter maturity yield moves above the selected longer maturity yield.
- The selected spread becomes inverted, but the macro interpretation depends on the driver mix.
This is why Treasury yields must be interpreted by maturity. A high short-term yield and a lower long-term yield do not automatically carry the same message as a broad, persistent inversion across many maturities.
What An Inversion Can And Cannot Mean
A yield curve inversion can indicate that the rates market is pricing a tighter current policy environment against weaker future conditions. It may reflect expectations for slower growth, lower future inflation, lower future policy rates, stronger demand for long-duration safe assets, or a change in the compensation investors require for long-term bonds.
Interpretation limit: Yield curve inversion is a macro structure signal, not a standalone recession forecast. It can raise the importance of recession-risk analysis, but it does not prove when a recession will occur, whether risk assets will fall, or what allocation decision should be made.
The long end of the curve can be affected by term premium, inflation expectations, and safe-asset demand. The same inversion reading can therefore have different meanings depending on whether long yields are falling because growth expectations are weakening, inflation expectations are cooling, or investors are seeking safety.
The yield lens also matters. Nominal yields show quoted rates before inflation adjustment, while real yields help separate the inflation-adjusted pressure behind the same nominal rate move. Inversion becomes more informative when those lenses are separated rather than compressed into a single recession slogan.
Practical Scenario
A practical scenario is that the front end of the curve remains elevated because policy expectations stay restrictive, while longer maturities fall or remain lower because markets expect weaker future growth or lower future inflation. The selected spread inverts. That condition can be meaningful, but the interpretation still depends on which spread inverted, how persistent the inversion is, and whether other macro signals confirm broader stress.
The same scenario should not be converted into a market-timing rule. If credit stress is muted, liquidity conditions are stable, and risk appetite remains firm, the inversion may be one signal inside a mixed regime. If the inversion appears alongside weakening breadth, wider credit spreads, and deteriorating liquidity, the macro message becomes stronger, but still not deterministic.
Common Misreadings
- Treating one spread as the whole curve: A 10Y-2Y inversion does not automatically mean every maturity relationship is inverted.
- Treating inversion as a guarantee: Inversion can be associated with recession-risk analysis, but it does not guarantee a recession or fix the timing.
- Using it as a stock-market timing signal: Yield curve structure is macro context, not a direct buy or sell instruction.
- Mixing 10Y-2Y with 10Y-3M: Both are watched, but they compare different maturities and can carry different information.
- Quoting current values without a date: Spread levels change over time and require a direct, dated data source.
Another common confusion is the difference between curve flattening and inversion. Flattening means the spread between shorter and longer maturities is narrowing. Inversion begins only when the selected short maturity yield moves above the selected longer maturity yield.
Current Data Belongs To Dated Sources
Data caution: Current yield-spread values, recession-probability model readings, and official macro estimates should be checked from direct data or model sources with a visible date. Static educational definitions cannot replace dated yield-spread data, official model outputs, or source-specific methodology notes.
For a current reading, the relevant source depends on the question. A spread chart can answer whether a selected maturity spread is currently above or below zero. An official model page can explain how a model converts curve information into a probability estimate. Those are different tasks. The concept of yield curve inversion helps interpret the structure, but live data and model outputs require current source review.
Related Concepts
A clean rates sequence starts with the yield curve itself, then separates curve shape, maturity-specific yields, and the drivers of long-end interpretation.
- Yield curve: the full maturity-structure concept.
- Normal yield curve: the upward-sloping contrast.
- Curve flattening: the stage where the spread narrows before inversion.
- Treasury yields: maturity-specific yield interpretation.
- Nominal yields and real yields: quoted versus inflation-adjusted yield pressure.
- Term premium: long-end yield interpretation.
Interpretation Boundary
Yield curve inversion is useful when the maturity spread, curve segment, and driver mix are named clearly. It becomes weaker when it is reduced to a broad recession slogan. The strongest interpretation separates the observable spread from the macro story built around it.