
A flat yield curve means shorter and longer maturities offer similar yields because the spread between them has narrowed. Yield curve flattening is the process that moves the curve toward that shape. Inversion is a separate condition where shorter maturities yield more than longer maturities.
The shape can reflect policy expectations, growth and inflation expectations, term premium, and real-yield pressure, but it does not prove a recession or create a standalone investment signal. A flat curve is an observation about the term structure of interest rates, not a complete macro verdict.
Definition: A flat yield curve is a yield-curve shape where short-term and long-term yields are relatively close to each other, making the curve appear nearly level instead of clearly upward sloping or inverted.
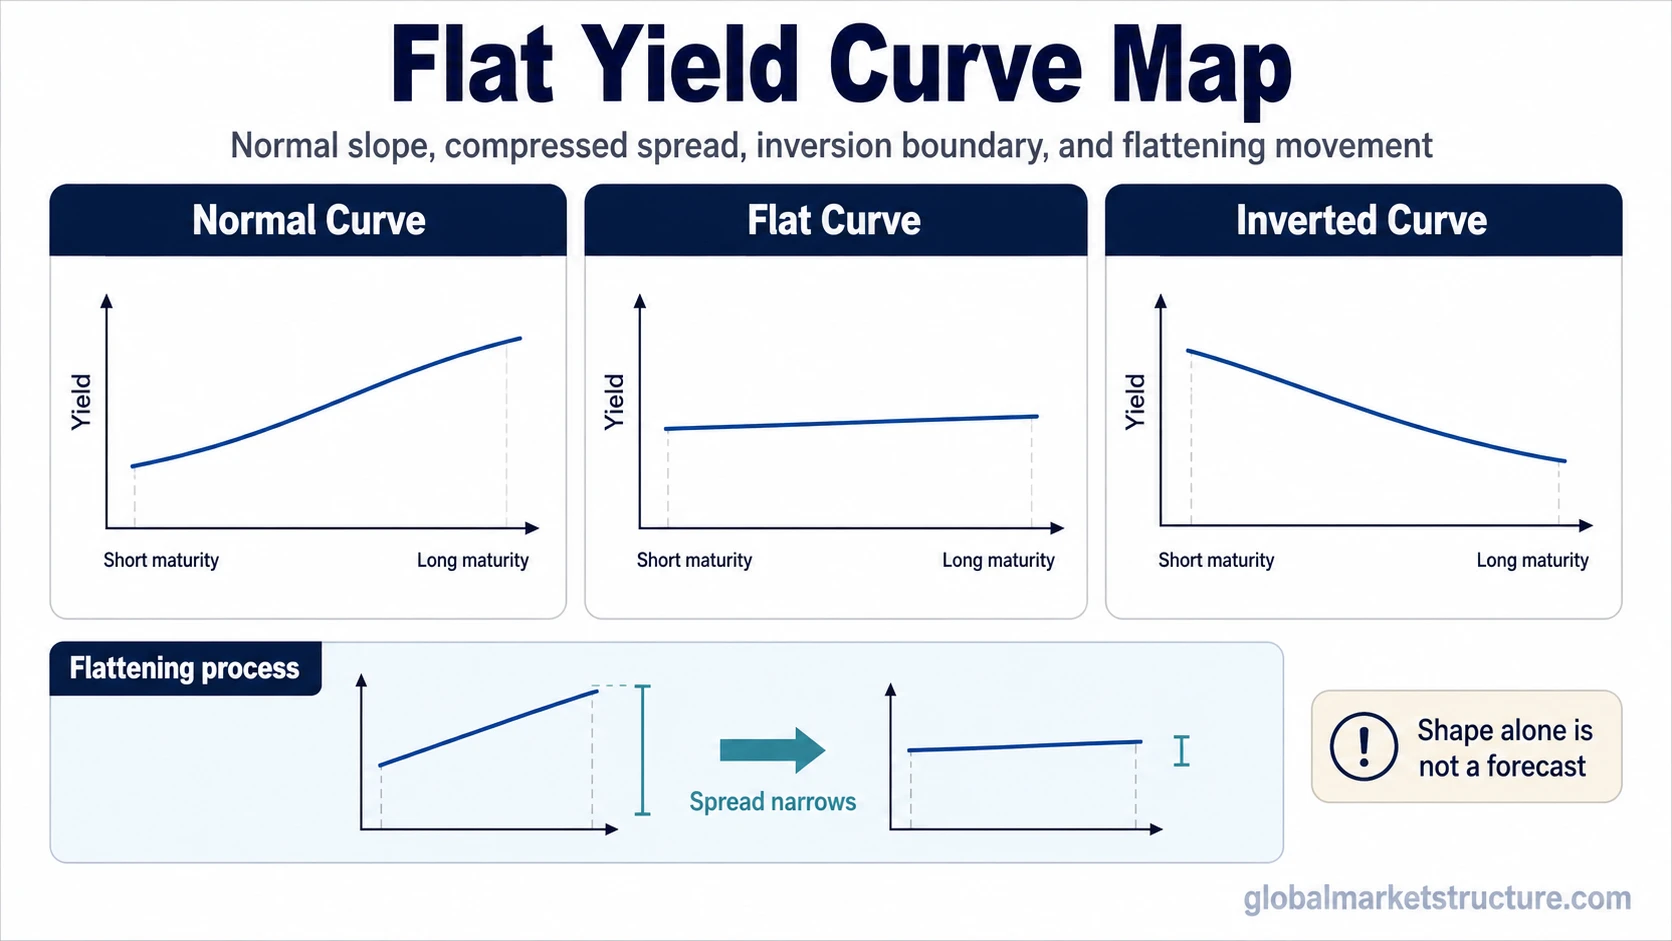
A normal curve is usually upward sloping, a flat curve compresses the maturity spread, and an inverted curve moves beyond flatness by placing shorter yields above longer yields.
Key Points
- A flat yield curve means shorter and longer maturities offer similar yields.
- Curve flattening is the process of maturity spreads narrowing, not the same as inversion.
- Flattening can come from rising short-end yields, falling long-end yields, or both parts of the curve moving differently.
- Curve shape alone does not prove recession, define market timing, or create an investment instruction.
What a Flat Yield Curve Means
A yield curve compares interest rates across different maturities. In a normal upward-sloping curve, longer maturities usually offer higher yields than shorter maturities. In a flat yield curve, that gap has narrowed until short and long maturities sit close together.
The important signal is not only the shape. The level of yields also matters. A flat curve with high yields can create a different macro pressure than a flat curve with low yields. A flat curve caused by rising short-term rates can also mean something different from a flat curve caused by falling long-term yields.
That is why a flat yield curve should be read as a condition that needs drivers. It can point to changing policy expectations, weaker long-term growth expectations, lower inflation expectations, shifting term premium, or tighter real-rate pressure. The same visible shape can come from several different combinations of forces.
Flat Yield Curve vs Yield Curve Flattening
A flat yield curve is the condition. Yield curve flattening is the movement toward that condition. The distinction matters because a curve can be flattening without being fully flat, and a flat curve can remain flat after the main flattening move has already happened.
| Concept | What it describes | Main interpretation issue |
|---|---|---|
| Flat yield curve | A curve shape where short and long maturities have similar yields. | The curve shape needs context from yield levels, real rates, credit, and macro conditions. |
| Yield curve flattening | A process where the spread between shorter and longer maturities narrows. | The driver matters: the short end may rise, the long end may fall, or both may move differently. |
| Yield curve inversion | A separate condition where shorter maturities yield more than longer maturities. | Inversion is not the same as flatness, even though flattening can move the curve closer to inversion. |
The opposite directional process is curve steepening, where the spread between shorter and longer maturities widens instead of narrows.
Why Yield Curves Flatten
Yield curves flatten when the gap between shorter and longer maturities contracts. The contraction can happen through different paths, and each path carries a different interpretation.
- Short-end yields rise: Policy-rate expectations, tighter central-bank settings, or higher expected short-term funding costs can lift shorter maturities.
- Long-end yields fall: Lower long-term growth expectations, lower inflation expectations, demand for longer-duration bonds, or lower term premium can pull down longer maturities.
- Both segments move differently: The short end can rise while the long end stays stable, or the long end can fall while the short end moves less.
- Yield levels change the message: A flat curve at high yield levels can pressure credit, duration-sensitive assets, and funding conditions differently than a flat curve at low yield levels.
- Real-rate pressure changes the reading: A nominally flat curve can still contain different inflation-adjusted pressure when the real interest rate backdrop is shifting.
Interpretation note: Curve flattening is more useful when the driver is identified. A narrowing spread caused by rising short-end yields does not carry the same message as a narrowing spread caused by falling long-end yields.
What a Flat Yield Curve Can and Cannot Suggest
A flat curve can suggest that markets are reassessing the relationship between current policy conditions and longer-term growth or inflation expectations. It cannot identify the full macro regime by itself.
| Observable condition | What it can suggest | What it cannot prove | Additional context needed |
|---|---|---|---|
| Short and long yields are close together | The maturity spread has narrowed and the curve is no longer clearly upward sloping. | It does not prove recession, policy error, or a market turning point. | Yield levels, real yields, inflation expectations, credit spreads, and risk appetite. |
| Short-end yields rise faster than long-end yields | Policy expectations or funding-rate pressure may be affecting the front end. | It does not prove that long-term growth expectations are collapsing. | Central-bank guidance, money-market conditions, inflation data, and long-end behavior. |
| Long-end yields fall while short-end yields remain firm | Markets may be marking down longer-term growth, inflation, or term-premium assumptions. | It does not prove that short-term policy is the only driver. | Growth expectations, inflation expectations, duration demand, and term premium. |
| The curve is almost flat but not inverted | The term structure is close to a boundary between normal slope and inversion. | It does not mean inversion has already occurred. | Exact maturity pair, date, data source, and spread calculation. |
Any real-world flat-curve reading should specify the maturity pair, observation date, data source, and spread calculation before drawing a macro interpretation.
Flat Yield Curve Example
Example: A shorter maturity yields 4.1% and a longer maturity yields 4.3%. The spread is narrow, so the curve is close to flat across those two points. If the shorter maturity later rises to 4.4% while the longer maturity stays near 4.3%, the curve has flattened further and may be close to inversion.
The example only illustrates the mechanics of spread narrowing. It does not identify a real market episode, a policy decision, or a recession signal. The interpretation would still depend on why the short maturity rose, why the long maturity did not rise with it, and whether credit, inflation expectations, real yields, and risk conditions confirm the same message.
The interpretation becomes more complete when curve behavior aligns with other macro evidence. The interpretation remains weaker when the curve shape changes for technical or positioning reasons while broader liquidity, credit, and risk measures do not confirm the same regime message.
Common False Readings
Recession risk needs confirmation: A flat yield curve can appear during periods of policy uncertainty, growth uncertainty, inflation repricing, or term-premium shifts. It can be associated with late-cycle caution, but it is not a deterministic forecast.
Flatness and inversion are separate conditions: Flatness means the spread is narrow. Inversion begins only when shorter maturities yield more than longer maturities.
Short rates are not the only driver: Long-term yields can fall, term premium can shift, or both ends of the curve can move in ways that reduce the spread.
Curve shape is a context input, not an allocation rule: The curve can help frame monetary and macro conditions, but it does not say what to buy, sell, hedge, or avoid.
Related Yield-Curve Concepts
Flatness is one part of the yield-curve map. A complete rates interpretation usually separates the curve shape, the direction of spread change, the level of yields, and the inflation-adjusted rate backdrop.
Curve steepening helps explain the opposite spread movement. Real interest rate analysis adds the inflation-adjusted pressure that nominal yield levels can hide. Other yield-curve concepts add separate layers, but the flat-curve reading should remain anchored in the spread between selected maturities and the drivers behind that spread.
FAQ
What does a flat yield curve mean?
A flat yield curve means shorter and longer maturities have similar yields. The spread between them has narrowed, so the curve is no longer clearly upward sloping.
Is a flat yield curve the same as yield curve inversion?
No. A flat yield curve means the spread between shorter and longer maturities is narrow. Yield curve inversion means shorter maturities yield more than longer maturities.
Does a flat yield curve predict recession?
A flat yield curve can reflect caution about growth, inflation, policy, or term premium, but it does not predict recession by itself. The reading needs confirmation from yield levels, real rates, credit conditions, and broader risk signals.
What causes yield curve flattening?
Yield curve flattening can happen when short-end yields rise, long-end yields fall, or both parts of the curve move differently. The driver matters more than the shape alone.