
Stock-bond correlation measures how equity returns and bond returns move relative to each other over a chosen period. The relationship can be positive, negative, or near zero. It changes when inflation pressure, growth risk, real yields, policy expectations, credit stress, or risk appetite become the dominant market driver. Correlation is not a forecast, hedge guarantee, or allocation rule.
Definition: Stock-bond correlation is the observed co-movement between equity returns and bond returns over a defined measurement window. It describes relationship, not causality.
What Stock-Bond Correlation Is and Is Not
Correlation classifies the relationship between two return streams. A negative reading means stocks and bonds moved in opposite directions during the measured period. A positive reading means they moved in the same direction. A near-zero reading means the relationship was weak or unstable over that window.
The result depends on the chosen equity proxy, bond proxy, return frequency, currency, and rolling period. A short window can show a different relationship from a longer window, especially when inflation, policy expectations, or risk appetite shift quickly.
| What it is | What it is not |
|---|---|
| A measured relationship between equity returns and bond returns. | A proof that one asset caused the other to move. |
| A way to observe whether stocks and bonds moved together, apart, or with little connection. | A guarantee that bonds will hedge equity risk in the next regime. |
| An input for cross-asset regime interpretation. | A yield forecast, recession signal, or trading signal by itself. |
| A measurement that changes with proxy, window, return frequency, and macro conditions. | A stable law that applies equally across every country, bond type, and time horizon. |
Positive, Negative, and Near-Zero Stock-Bond Correlation
A negative stock-bond correlation means equity returns and bond returns moved in opposite directions during the chosen period. This can support diversification analysis when high-quality bonds rise during equity weakness. The reading still depends on the bond exposure, duration profile, inflation backdrop, and measurement window.
A positive stock-bond correlation means equities and bonds moved in the same direction. This can occur when the dominant pressure affects both assets at once, such as a rise in required returns or inflation-linked yield pressure. The specific mechanism matters more than the sign alone.
A near-zero correlation means the measured relationship was weak. It does not mean the assets are unrelated in every sense. It means the selected data window did not show a strong linear return relationship.
Why the Relationship Changes Across Macro Regimes
Stock-bond correlation changes because equities and bonds can respond to different dominant drivers. Growth risk, inflation pressure, real yields, policy expectations, credit spreads, and risk appetite can pull the relationship in different directions.
During a growth scare, high-quality bonds may behave differently from equities if investors seek duration and policy expectations shift toward easier conditions. During an inflation shock, the same bond exposure may struggle if yields rise and bond prices fall while equity valuations face higher discount-rate pressure.
| Driver | Mechanism | Interpretation limit |
|---|---|---|
| Growth shock | Equities can weaken as earnings expectations or risk appetite fall, while high-quality bonds may benefit from lower yield expectations. | The relationship depends on whether inflation and policy constraints allow yields to fall. |
| Inflation shock | Yields can rise, bond prices can fall, and equity valuations can face discount-rate pressure. | Positive correlation can reflect shared rate pressure, not a recession forecast by itself. |
| Real-yield pressure | Higher real yields can pressure long-duration assets by raising the required return used to discount future cash flows. | The equity impact is not uniform across sectors, margins, earnings durability, or valuation starting points. |
| Policy reaction | Expected central-bank response can change whether bonds absorb equity stress or share the same pressure. | Current policy headlines should not replace the structural reading of the regime. |
| Credit spreads | Credit-risk-heavy bonds can behave more like risk assets when spread stress dominates. | High-yield bonds and high-quality government bonds should not be treated as the same bond exposure. |
| Risk appetite | Broad risk-on or risk-off conditions can change capital flows across equities, government bonds, credit, and cash-like assets. | Correlation still needs confirmation from the wider cross-asset backdrop. |
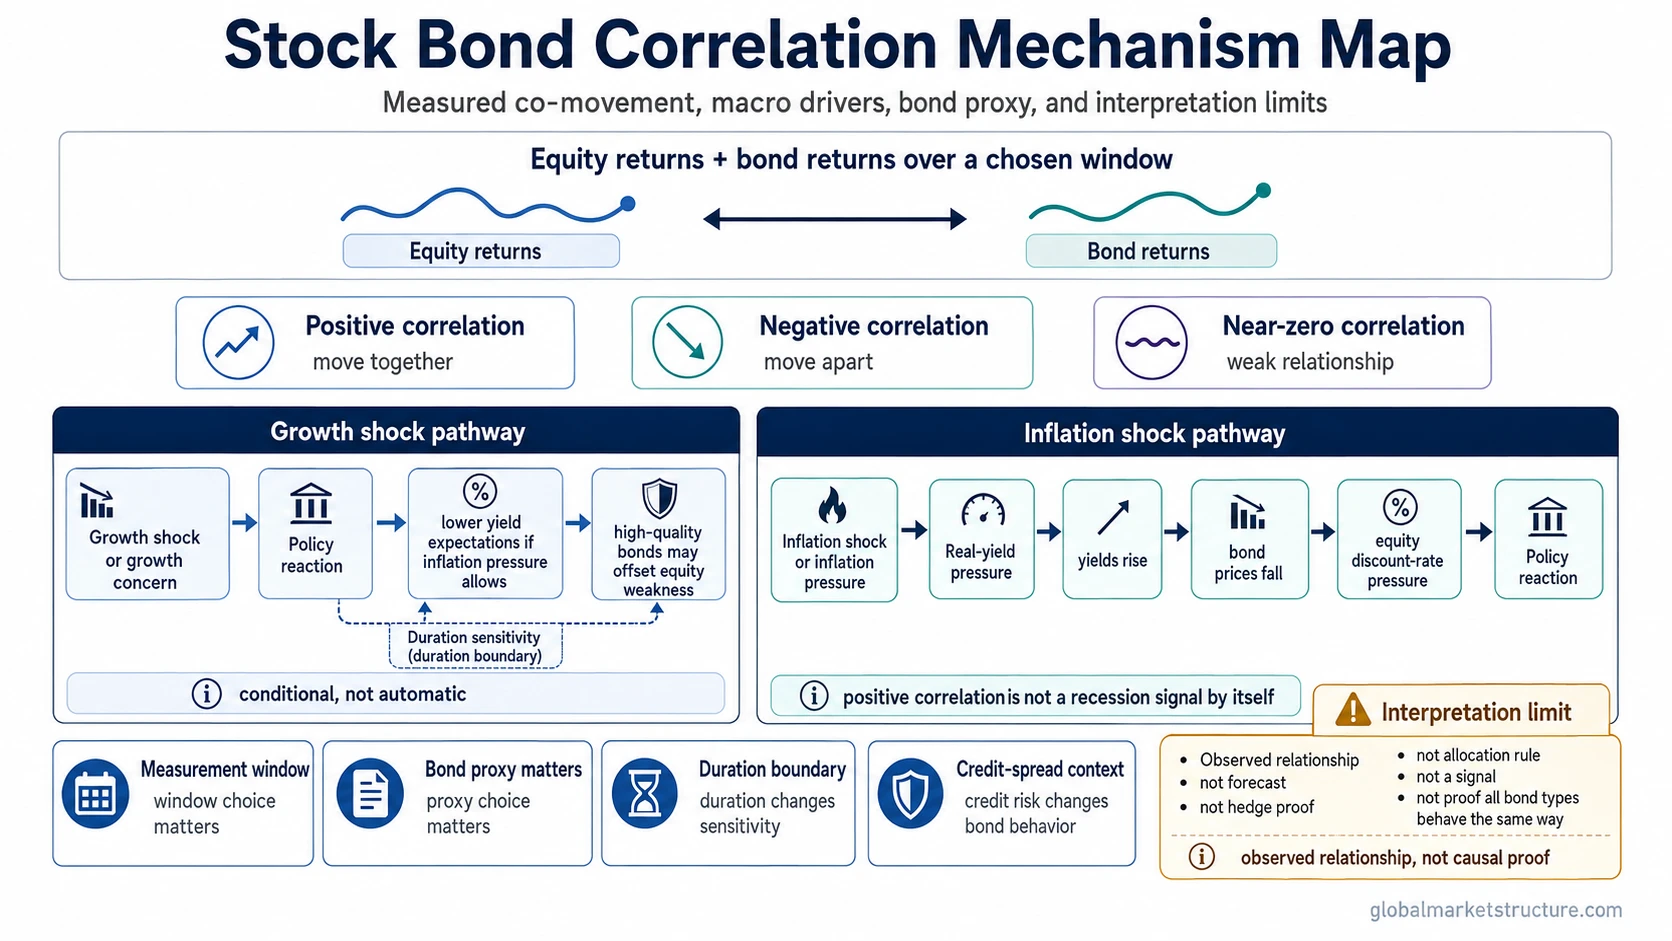
Growth Shock vs Inflation Shock
The growth-shock case usually starts with weaker growth expectations and lower risk appetite. If inflation pressure is not the dominant constraint, equities may fall while high-quality bonds may rise as yields decline. That can create a more negative stock-bond correlation.
The inflation-shock case works differently. If inflation pressure or policy tightening pushes yields higher, bond prices can fall. At the same time, equities can face pressure from higher discount rates, margin concerns, or weaker risk appetite. That can move the relationship toward positive correlation.
The label matters less than the dominant force behind the cross-asset reaction. Correlation is evidence to interpret, not a mechanical answer.
How to Measure Stock-Bond Correlation
Stock-bond correlation is only as clear as the measurement design behind it. A reading based on local-currency equity returns and 10-year government bonds can tell a different story from a reading based on global equities and high-yield credit. The bond market proxy matters because bond returns are shaped by duration, credit quality, yield level, and currency context.
| Measurement choice | Why it matters | Common mistake |
|---|---|---|
| Equity proxy | Large-cap, global, sector-heavy, or country-specific equity indexes can behave differently. | Treating one equity index as universal equity behavior. |
| Bond proxy | Government bonds, aggregate bonds, investment-grade credit, and high-yield credit carry different drivers. | Using “bonds” as one undifferentiated asset class. |
| Return frequency | Daily, weekly, and monthly returns can show different co-movement patterns. | Comparing correlation readings built from different frequencies. |
| Rolling window | Short windows can react quickly, while long windows smooth regime shifts. | Assuming the latest window defines the next regime. |
| Currency | Currency translation can change the measured return relationship for global investors. | Mixing local and unhedged returns without noticing the difference. |
| Time horizon | Short-term stress and long-cycle correlation can send different signals. | Using one horizon to answer every interpretation question. |
Bond Type and Duration Boundary
Stock-bond correlation is often discussed as if bonds are one uniform exposure. That shortcut can distort the interpretation. High-quality government bonds, long-duration bonds, inflation-linked bonds, investment-grade credit, and high-yield bonds can respond to different combinations of rates, inflation, growth, and credit stress.
Duration is especially important when yields move. Longer-duration bond exposures are usually more sensitive to changes in yields than shorter-duration exposures. That makes duration risk a key boundary when interpreting why bonds may or may not offset equity weakness in a specific regime.
Boundary: A stock-bond correlation reading should specify the bond type before drawing conclusions. Government-bond correlation, aggregate-bond correlation, and high-yield correlation do not necessarily describe the same market relationship.
Inflation-Shock Scenario for Positive Stock-Bond Correlation
Inflation pressure rises while policy expectations shift toward tighter conditions. Yields move higher, so bond prices fall. Equity valuations also face pressure because higher required returns reduce the present value of future cash flows. In that setting, equities and bonds may both decline during the same measurement window.
The scenario does not prove that stocks and bonds must keep falling together. It shows how one macro driver can pressure both return streams at once. A stronger interpretation would compare inflation expectations, real yields, credit spreads, equity breadth, and policy expectations before treating the correlation shift as a broader regime signal.
Positive stock-bond correlation can show that the diversification behavior often associated with high-quality bonds is temporarily weaker or differently conditioned. When stocks and bonds fall together, the interpretation usually needs a narrower check of inflation pressure, yield repricing, liquidity stress, and whether the move is temporary or regime-driven.
Common Mistakes and Interpretation Limits
| Common mistake | Safer interpretation |
|---|---|
| Treating negative correlation as a permanent property of bonds. | The relationship can change when inflation, real yields, policy constraints, or credit stress become the dominant driver. |
| Reading positive correlation as a recession signal by itself. | Stocks and bonds can move together for several reasons, including inflation pressure, real-yield repricing, liquidity stress, or risk-premium changes. |
| Using the latest rolling correlation as a forecast. | Correlation describes what happened over the selected window. It does not determine what must happen next. |
Limitation: Stock-bond correlation should be interpreted with macro context. It does not set allocation weights, predict yield direction, identify recession timing, or provide a buy/sell signal.
Interpretation Boundaries
Stock-bond correlation becomes easier to read when the fixed-income side, yield sensitivity, and positive-correlation failure mode are separated instead of treated as one broad signal.
| Concept boundary | Use when the question is about |
|---|---|
| Bond market | How bond returns, yields, credit quality, and fixed-income structure fit into cross-asset analysis. |
| Duration risk | Why bond prices can be more or less sensitive to yield changes. |
| Stocks and bonds falling together | Why positive stock-bond correlation can appear during inflation, rate, or liquidity pressure. |
FAQ
Are stocks and bonds always negatively correlated?
No. Stocks and bonds can have negative, positive, or near-zero correlation depending on inflation pressure, growth expectations, policy reaction, bond type, duration, and the measurement window.
Why can stocks and bonds fall together?
Stocks and bonds can fall together when the same pressure affects both assets. A common case is rising yields, where bond prices fall and equity valuations face higher required-return pressure.
Is stock-bond correlation a forecast?
No. Stock-bond correlation measures co-movement over a chosen period. It can support regime interpretation, but it does not forecast yields, equity returns, recessions, or allocation outcomes by itself.
Does bond type matter for stock-bond correlation?
Yes. High-quality government bonds, aggregate bonds, investment-grade credit, and high-yield bonds can carry different rate, inflation, and credit-risk exposures, so they should not be treated as identical.