
Volatility clustering is the tendency for large price changes to occur near other large changes and small price changes to occur near other small changes. It describes persistence in movement intensity through time and is one input into broader volatility and risk-environment analysis.
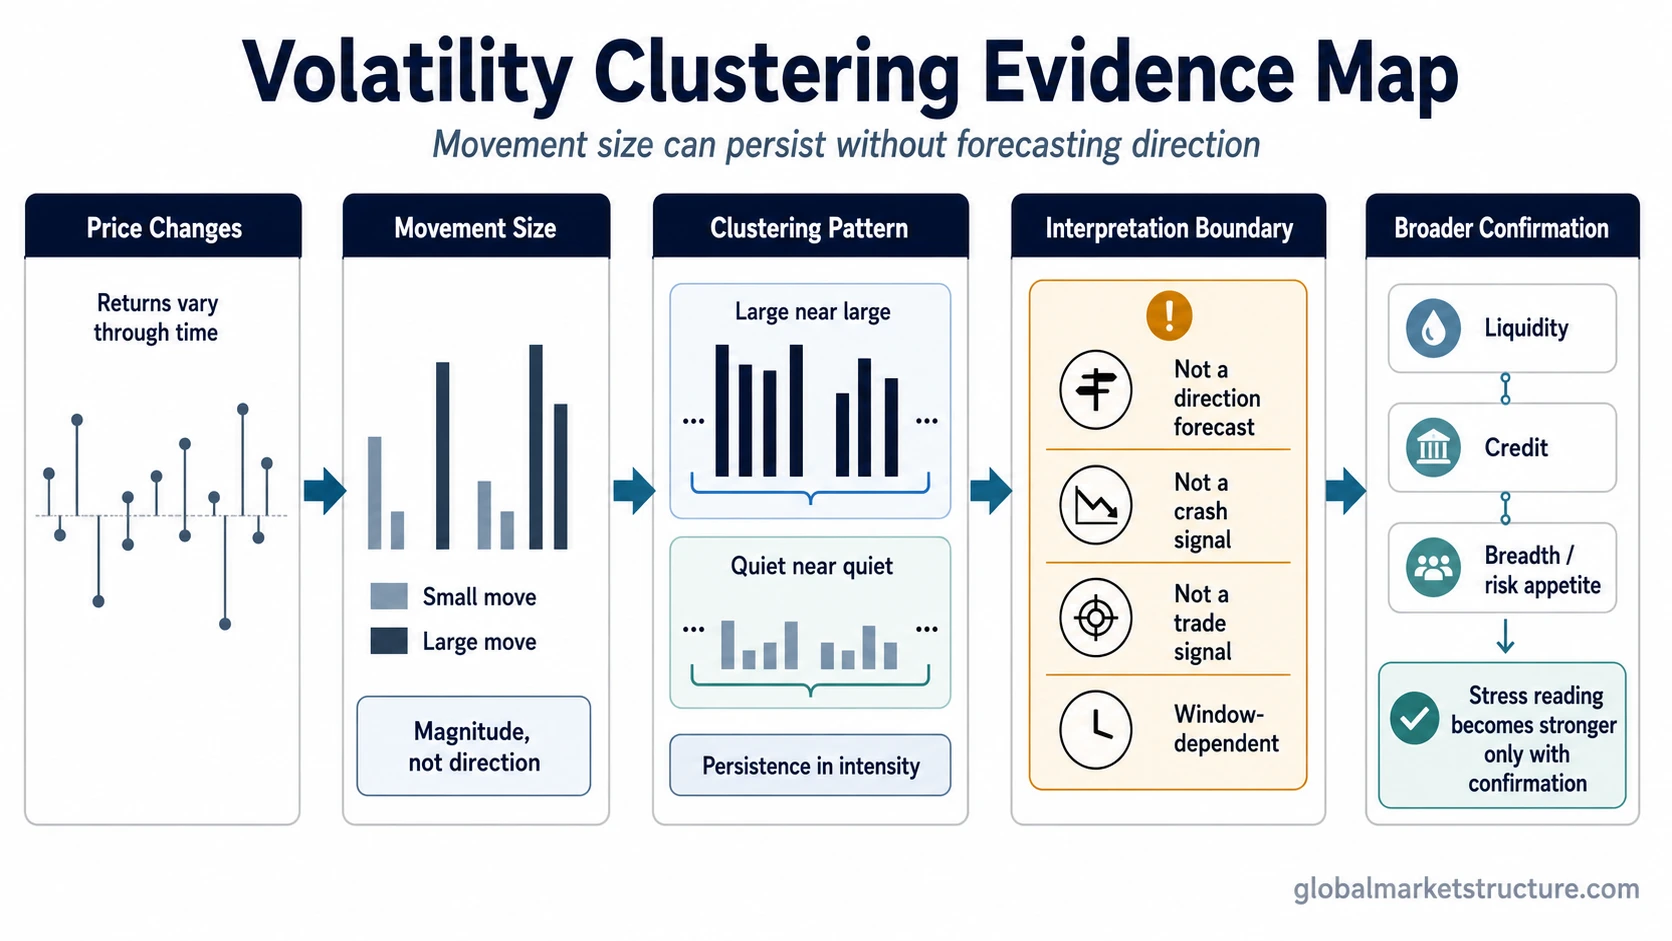
Movement Size and Price Direction Are Separate
Large positive and negative returns can both belong to a high-volatility cluster. The persistence question and the direction question therefore need separate evidence.
Are large or small price changes continuing to appear near one another?
Are returns positive, negative, or alternating while that movement intensity persists?
How Volatility Clustering Appears in Market Data
The pattern becomes visible when the size of returns is uneven through time. Larger changes group into more active periods, while smaller changes group into calmer periods. Raw return direction can remain difficult to predict even when the magnitude of returns shows persistence.
A common quantitative approach is to examine absolute returns, squared returns, or related volatility measures for persistence across time. ARCH and GARCH models are closely associated with this problem because they allow conditional variance to change rather than assuming one constant volatility level.
NYU Stern’s V-Lab describes financial markets as showing large positive or negative price movements followed by additional large movements. BIS research uses the same large-follow-large and small-follow-small framing and explains why GARCH processes are commonly used to describe this behavior. Source: NYU Stern V-Lab. Source: BIS.
The measurement horizon still matters. A pattern observed in daily returns does not automatically have the same strength or duration in intraday or monthly data, so the sampling interval and lookback window should match the analytical question.
How Clustering Fits Into Market-Structure Analysis
Clustering helps distinguish an isolated volatility shock from movement intensity that is persisting through time. A cluster of large moves can support a broader stress reading when liquidity, credit, breadth, options, or cross-asset evidence is also deteriorating. If those layers do not agree, the clustering observation should remain descriptive rather than being upgraded into a broader stress conclusion.
The same logic applies to quiet periods. A cluster of smaller moves shows persistent low movement intensity, but it does not establish why volatility is compressed or how long that condition will last.
Volatility Clustering and Nearby Concepts
| Concept | Main question | Analytical boundary |
|---|---|---|
| Volatility clustering | Is the magnitude of price movement showing persistence through time? | Describes serial behavior in movement intensity. |
| Volatility regime | Is the broader volatility environment persistently low, high, unstable, or transitioning? | Classifies a broader state rather than the clustering pattern itself. |
| Volatility risk premium | How is volatility risk being priced relative to realized or expected realized volatility? | Concerns pricing and compensation rather than serial persistence in movement magnitude. |
The pattern can show that movement intensity is persistent. It does not by itself establish market stress, systemic risk, or a directional forecast. Those conclusions require separate evidence.