
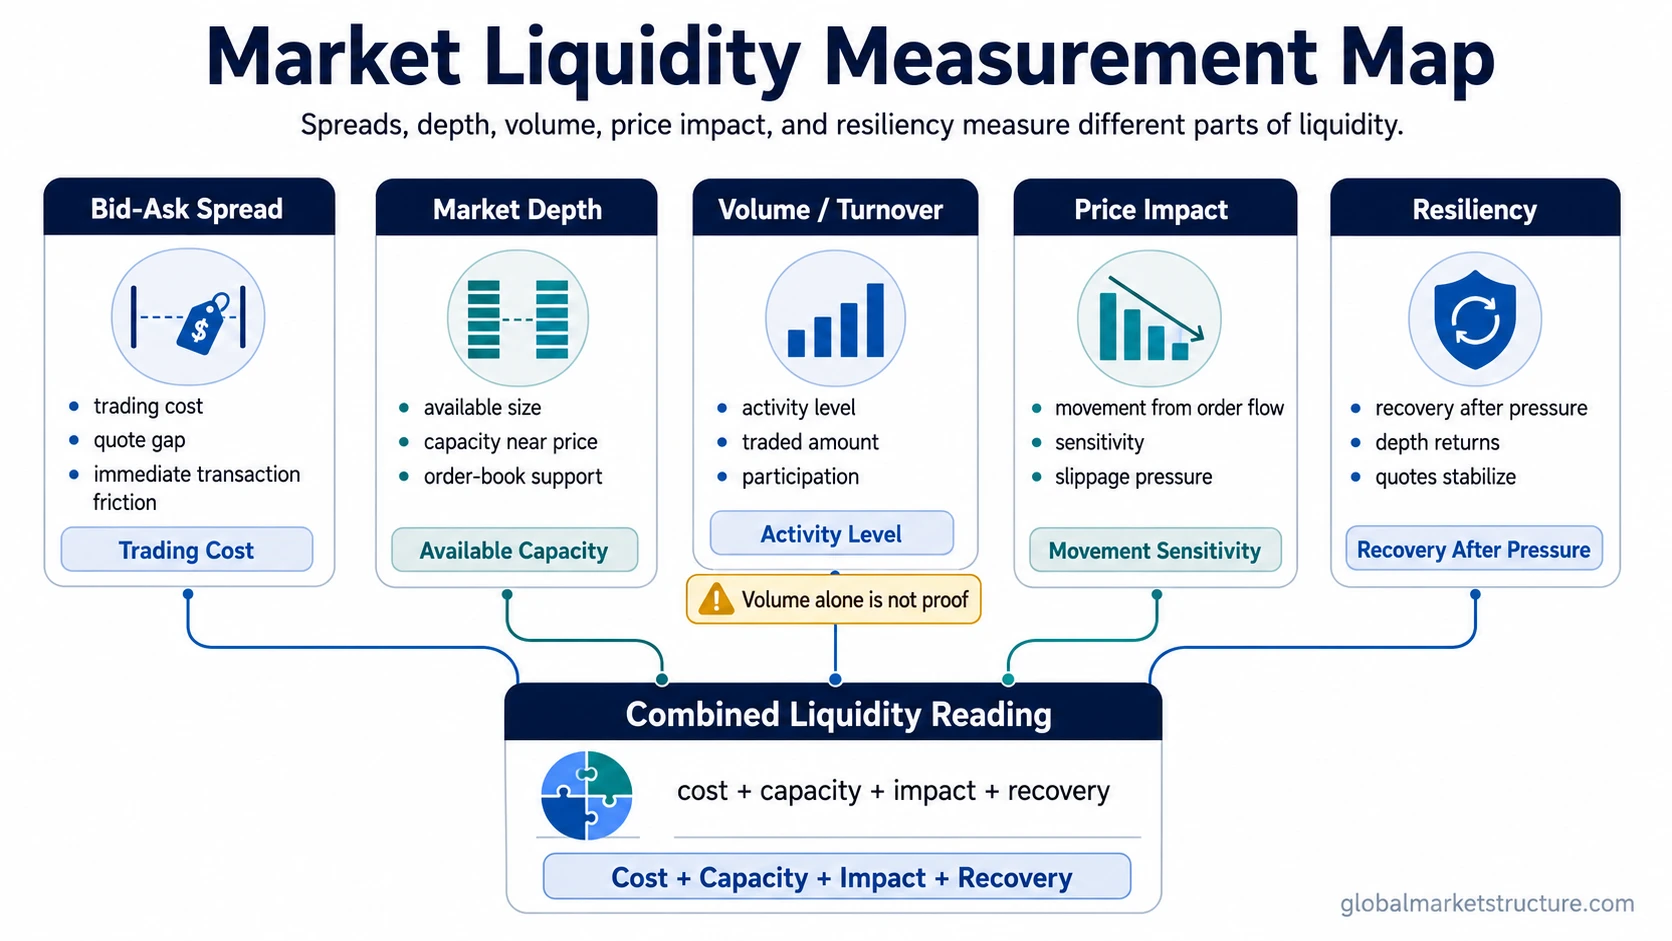
Market liquidity is measured with several observable proxies, not volume alone. The main measures are bid-ask spread, market depth, volume or turnover, price impact, and resiliency. A stronger market liquidity reading usually appears when transaction costs are low, meaningful size is available, price impact is limited, and trading conditions recover after order-flow pressure.
High Volume Does Not Prove Strong Liquidity
Common misread: high volume means liquidity is always strong.
Safer interpretation: volume shows activity, but liquidity quality also depends on spreads, visible depth, price impact, and recovery after pressure. A market can trade heavily while the cost of transacting rises and available depth becomes thinner.
The Core Measures of Market Liquidity
Market liquidity measurement usually combines cost, capacity, activity, movement sensitivity, and recovery. Each measure captures one part of the trading environment. None of them is complete on its own.
| Measure | What it observes | What it misses | When to combine it |
|---|---|---|---|
| Bid-ask spread | The transaction cost between the best quoted buying and selling prices. | How much size can trade at or near those prices. | Combine with depth and price impact to test whether tight quotes can absorb size. |
| Market depth | The visible quantity available near current prices. | Whether that depth remains stable when orders arrive. | Combine with spread and resiliency to judge whether displayed capacity is durable. |
| Volume or turnover | The amount of trading activity over a period. | Transaction cost, order-book depth, and the price movement caused by trades. | Combine with spread, depth, and price impact because activity can rise during stress. |
| Price impact | How much the price moves when trades or order flow hit the market. | Whether the move came from one large order, thin depth, news, or broader repricing. | Combine with depth and volume to separate normal activity from fragile liquidity. |
| Resiliency | How quickly quotes, depth, and transaction conditions recover after pressure. | The exact cause of the pressure without broader context. | Combine with spread and price impact when liquidity appears to weaken during stress. |
Bid-Ask Spread Measures Trading Cost
The bid-ask spread is the gap between the best available bid and the best available ask. A narrower spread usually points to lower immediate transaction cost. A wider spread usually means participants require more compensation to trade, or that market makers are less willing to quote aggressively.
Spread alone can mislead when quoted size is small. A tight spread with very little depth may not support larger trades without meaningful price movement.
Market Depth Measures Available Capacity
Market depth describes how much quantity is available near the current price. Deeper markets can usually absorb more order flow before price moves sharply. Thin markets can move quickly because fewer resting orders are available to meet demand or supply.
Depth should be read with care because displayed capacity can change. Liquidity that looks available in calm conditions may disappear when volatility rises, risk limits tighten, or participants pull quotes.
Volume and Turnover Measure Activity, Not Full Liquidity Quality
Volume and turnover show how much trading occurred. They are useful because inactive markets often lack reliable trading capacity. The limitation is that activity does not prove low transaction cost or strong depth.
Heavy trading can occur when participants are rushing to reduce exposure, when quotes are widening, or when depth is being consumed faster than it is replaced. In that setting, high volume may coexist with weaker liquidity quality.
Price Impact Measures How Much Trading Moves the Market
Price impact measures how strongly prices respond to order flow. A liquid market can usually process meaningful trading with limited price movement. A less liquid market may move sharply when the same size hits a thinner order book.
Price impact is especially useful because it connects measurement to market behavior. If trades are causing larger moves than usual, liquidity may be weaker even if reported volume is high.
Resiliency Measures Recovery After Pressure
Resiliency describes how quickly trading conditions recover after order-flow pressure. A resilient market may widen temporarily, then rebuild depth and normalize transaction costs. A fragile market may stay wide, thin, and sensitive after the initial pressure fades.
Resiliency helps separate temporary activity from durable liquidity. The useful question is not only whether trading happened, but whether market conditions recovered after trading pressure arrived.
A Practical Failure Mode
A common scenario is a market with rising volume during stress. At first glance, the activity may look like strong liquidity because many transactions are occurring. The reading changes if bid-ask spreads widen, displayed depth falls, and similar order sizes begin moving prices more than usual.
In that scenario, volume shows that trading is active. Spread, depth, price impact, and resiliency show whether the market can absorb that activity without becoming fragile.
What Market Liquidity Measures Do Not Tell You
Market liquidity measures do not automatically predict market direction. They describe the conditions under which trading can occur. Weak liquidity can make price moves more sensitive to order flow, but it does not by itself identify a market top, bottom, recession, or timing decision.
Market liquidity also differs from funding liquidity. Market liquidity is about trading an asset without large price impact. Funding liquidity is about access to financing, collateral, and the ability to meet cash or margin needs.
Accounting Liquidity Ratios Are a Different Concept
Current ratio, quick ratio, and cash ratio measure balance-sheet liquidity for a company or borrower. They do not measure whether a market can absorb trades with low cost, meaningful depth, and limited price impact.
That distinction matters because the same word can describe different problems. Balance-sheet liquidity concerns cash resources and short-term obligations. Market liquidity concerns the trading environment for an asset or market.
How to Read the Measures Together
A stronger liquidity reading usually requires several measures to point in the same direction. Tight spreads, deeper visible capacity, low price impact, steady turnover, and resilient recovery create a more complete picture than any single metric.
A weaker reading often appears when measures disagree. Volume may rise while spreads widen. Depth may fall while prices become more sensitive to order flow. Quotes may recover slowly after pressure. Those combinations matter more than activity alone.
| Combined reading | Market-structure interpretation |
|---|---|
| Tight spreads plus deep order-book capacity | Transaction cost is low and more size may be available near current prices. |
| High volume plus widening spreads | Activity is high, but transaction cost may be rising. |
| High volume plus falling depth | Trading is active, but available capacity may be thinning. |
| Normal volume plus higher price impact | The market may be more sensitive to order flow than the activity level suggests. |
| Temporary widening followed by quick recovery | Liquidity pressure may be short-lived if depth and spreads normalize. |
| Widening spreads, thin depth, high price impact, and slow recovery | Liquidity quality may be fragile even when trading activity remains visible. |
Clean Measurement Boundary
Market liquidity measurement is strongest when activity, cost, capacity, price impact, and recovery are separated. Volume belongs in the framework, but it does not replace the framework. A market is easier to trade when transaction cost is low, depth is available, price impact is limited, and trading conditions recover after pressure.
Related Concepts
The broader concept of market tradability sits inside the larger liquidity framework. Financing pressure belongs to funding liquidity, while the risk of losing tradability or financing access belongs to liquidity risk.
FAQ
Is trading volume the same as market liquidity?
No. Trading volume measures activity. Market liquidity quality also depends on bid-ask spread, market depth, price impact, and resiliency.
Can high volume happen in a weak liquidity environment?
Yes. High volume can appear during stress if many participants are trying to trade at the same time. Liquidity quality may still weaken if spreads widen, depth falls, and prices move more sharply in response to order flow.
Are current ratio and quick ratio market liquidity measures?
No. Current ratio and quick ratio measure balance-sheet liquidity. Market liquidity measures the ease of trading an asset without large transaction cost or price impact.
Which market liquidity measure is best?
No single measure is best in all conditions. Bid-ask spread, depth, volume, price impact, and resiliency work better as a combined framework because each measure captures a different part of the trading environment.