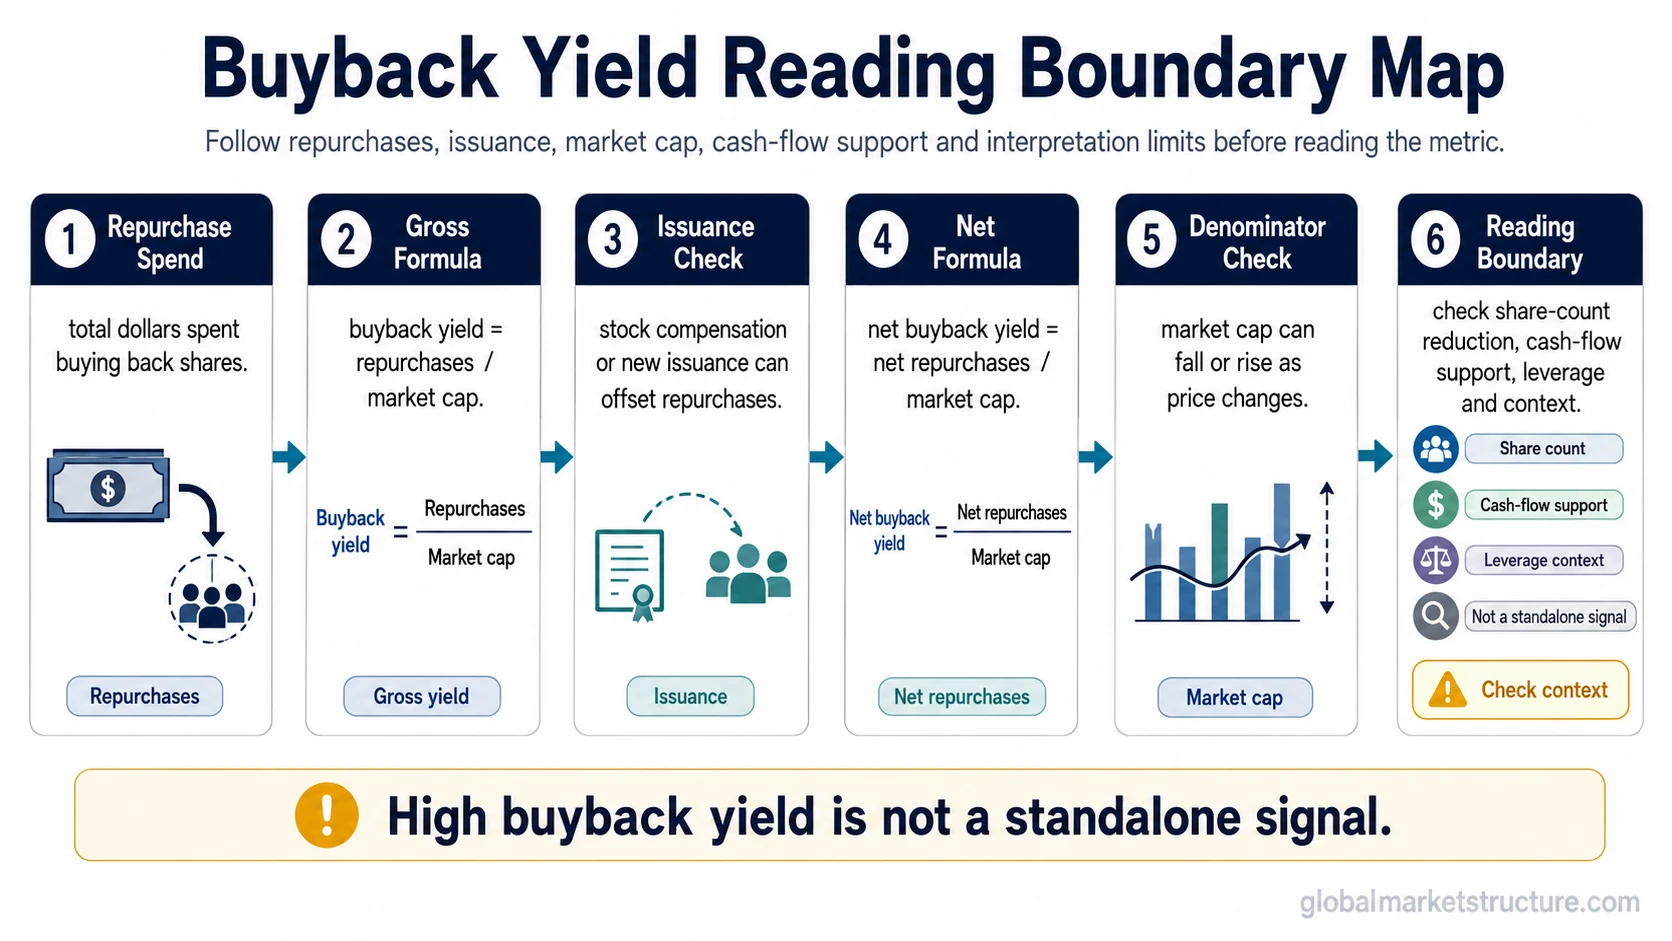
Buyback yield measures share repurchases relative to a company’s market capitalization. The simple formula is buyback yield = share repurchases / market capitalization. A more diagnostic version is net buyback yield, which adjusts for share issuance because repurchases only reduce share supply when they are larger than dilution.
Basic formula: Buyback Yield = Share Repurchases / Market Capitalization
Net formula: Net Buyback Yield = Net Repurchases / Market Capitalization
Reading boundary: a high buyback yield is not automatically bullish. It can reflect capital return, but the interpretation depends on net share-count reduction, cash-flow support, valuation context, leverage, and broader capital-flow conditions.
In market-structure terms, buyback yield connects corporate repurchases with equity demand and share supply. A company can spend cash buying back shares, but the metric becomes more meaningful when those repurchases reduce the actual share count rather than only offsetting new issuance.
What buyback yield measures
Buyback yield compares the amount spent on repurchases with the market value of the company. It turns repurchase activity into a yield-style measure, which makes it easier to compare buyback intensity across companies of different sizes.
The denominator matters. Market capitalization changes when price changes, so buyback yield can rise because repurchase activity increased, because the market cap fell, or because both happened at the same time. A falling market cap can mechanically lift buyback yield even when the company has not become more aggressive with repurchases.
For the broader repurchase mechanism, stock buybacks describe how companies reduce shares outstanding, return capital, or offset issuance. Buyback yield is narrower: it measures repurchase intensity relative to market value.
Buyback yield formula
Gross buyback yield: total share repurchases divided by market capitalization.
Net buyback yield: repurchases minus share issuance, divided by market capitalization.
Provider note: data providers may define the measurement period differently, such as trailing twelve months or fiscal year, and may use different market-cap conventions. That can change the reported value, especially when the share price moves sharply during the period.
A generic calculation example: if a company repurchases $2 billion of shares and its market capitalization is $100 billion, the gross buyback yield is 2%. If the company also issues $700 million of stock through compensation or other issuance, net repurchases are $1.3 billion and net buyback yield is 1.3%.
The net version usually gives a more useful reading of share-supply pressure because it asks whether repurchases actually reduced the share base. Gross repurchases can look large while the actual share count changes very little.
Gross buyback yield vs net buyback yield
Gross buyback yield focuses on how much money was spent on repurchases. Net buyback yield focuses on whether repurchases exceeded new issuance. The distinction matters because investors and market-structure readers are often trying to understand whether buybacks created real share-supply reduction.
| Metric | What it measures | Main limitation |
|---|---|---|
| Gross buyback yield | Total repurchase dollars relative to market capitalization. | Can overstate the effect if new issuance offsets repurchases. |
| Net buyback yield | Repurchases minus issuance relative to market capitalization. | Still needs context around market cap, cash flow, leverage, and timing. |
| Share-count reduction | Whether the number of shares outstanding actually falls. | May lag repurchase announcements and can be affected by compensation issuance. |
Common mistake: announced buyback authorization, gross repurchase dollars, and actual net share reduction are not the same thing. A company may authorize a large program, spend money on repurchases, and still show limited share-count reduction if issuance or dilution absorbs much of the effect.
Buyback yield vs dividend yield
Buyback yield and dividend yield are both capital-return measures, but they work through different channels. Dividend yield measures cash paid directly to shareholders. Buyback yield measures repurchases relative to market capitalization, with the practical effect depending on whether the share count falls.
| Measure | Capital-return channel | What the reader should check |
|---|---|---|
| Dividend yield | Cash paid directly to shareholders as dividends. | Dividend sustainability, payout ratio, cash-flow support, and cyclicality. |
| Buyback yield | Cash used to repurchase shares relative to market capitalization. | Net repurchases, share-count reduction, issuance, leverage, and repurchase timing. |
| Shareholder yield | A broader capital-return view that can include dividends, net buybacks, and sometimes debt reduction. | Methodology, whether buybacks are net of issuance, and whether all components are comparable. |
A dividend is visible as a cash distribution. A buyback is less direct: it may increase each remaining share’s claim on the company only if repurchases reduce the share base and are not offset by dilution or poor capital allocation.
Why buyback yield can matter for market structure
Buyback yield can matter because repurchases may create a recurring source of equity demand. When buybacks are funded by durable cash flow and reduce shares outstanding, they can support a lower share-supply backdrop. That can be relevant when reading capital flows, equity demand, and corporate participation in the market.
The interpretation weakens when repurchases do not create net share reduction. If a company buys back shares while issuing a similar amount through stock-based compensation, acquisitions, or other issuance, headline buyback yield can overstate the actual supply effect.
Cash-flow support also matters. Repurchases funded by sustainable free cash flow carry a different interpretation from repurchases funded by rising leverage or from buybacks made when business conditions are weakening. The metric can show repurchase intensity, but it cannot prove capital-allocation quality by itself.
When buyback yield becomes misleading
High buyback yield needs context. The ratio can rise because repurchases increased, because market capitalization fell, or because the company is buying back stock while other risks are increasing. A useful reading requires net share-count data, cash-flow context, balance-sheet context, and valuation discipline.
A practical scenario is dilution offset. A company may spend heavily on repurchases, but if employee stock compensation or new issuance absorbs much of that spending, the net share count may not fall meaningfully. In that case, gross buyback yield can make capital return look stronger than the actual share-supply reduction.
Another scenario is denominator distortion. If the share price falls sharply, market capitalization falls too. The same repurchase dollar amount can produce a higher buyback yield even though the higher ratio partly reflects a lower denominator rather than a stronger repurchase program.
| Condition | What it may suggest | Why the reading can fail |
|---|---|---|
| High gross buyback yield | The company is spending meaningful cash on repurchases relative to market cap. | Issuance or dilution may offset the repurchases, leaving little net share reduction. |
| High net buyback yield | Repurchases may be reducing the share base after issuance. | The reading still depends on cash-flow support, leverage, timing, and business quality. |
| Rising buyback yield after a price decline | Repurchases may look larger relative to the company’s market value. | The ratio may be rising because the denominator fell, not because repurchase activity became stronger. |
| Falling market cap with unchanged repurchases | The yield may rise mechanically. | A higher percentage does not necessarily mean stronger corporate demand or better capital allocation. |
| Buybacks funded by debt | The company may be prioritizing capital return despite limited internal cash generation. | Higher leverage can reduce flexibility if rates rise, earnings weaken, or refinancing conditions tighten. |
| Buybacks during cyclical strength | Management may be returning cash during a strong profit period. | If earnings are near a cyclical peak, the buyback pace may not be durable. |
| Buybacks alongside weak free cash flow | Headline capital return may still appear positive. | The program may be less sustainable if the business is not generating enough cash to support it. |
How to read buyback yield safely
Start with the formula, then check whether the ratio is gross or net. A gross figure can identify repurchase intensity, but a net figure is usually more useful for share-supply interpretation because it accounts for issuance.
Next, compare the buyback yield with share-count change. If the ratio is high but shares outstanding are not falling, the buyback program may be offsetting dilution rather than reducing supply. If shares outstanding are falling and free cash flow supports the repurchases, the metric becomes more useful as a capital-flow reading.
Finally, separate measurement from conclusion. The ratio measures repurchase intensity; it does not settle valuation, cash-flow quality, leverage risk, or future return expectations by itself.
Key points
- Buyback yield compares share repurchases with market capitalization.
- Net buyback yield is usually more informative than gross repurchase dollars because it adjusts for issuance.
- Dividend yield and buyback yield are different capital-return channels.
- The metric weakens if buybacks mainly offset dilution, rely on debt, or lack cash-flow support.
- Buyback yield should not be read as a standalone bullish signal.
FAQ
What is buyback yield?
Buyback yield measures share repurchases relative to market capitalization. It shows how large a company’s repurchase activity is compared with its market value.
How is buyback yield calculated?
The simple formula is share repurchases divided by market capitalization. Net buyback yield uses repurchases minus share issuance, then divides that net amount by market capitalization.
What is net buyback yield?
Net buyback yield adjusts repurchases for share issuance. It is often more useful than gross buyback yield because it focuses on whether repurchases actually reduce share supply.
Is buyback yield the same as dividend yield?
No. Dividend yield measures cash dividends paid directly to shareholders. Buyback yield measures share repurchases relative to market capitalization, and its effect depends on whether the share count falls.
Is a high buyback yield bullish?
Not by itself. A high buyback yield can reflect strong repurchase activity, but it can also be distorted by dilution, a falling market cap, weak cash-flow support, leverage, or poor repurchase timing.