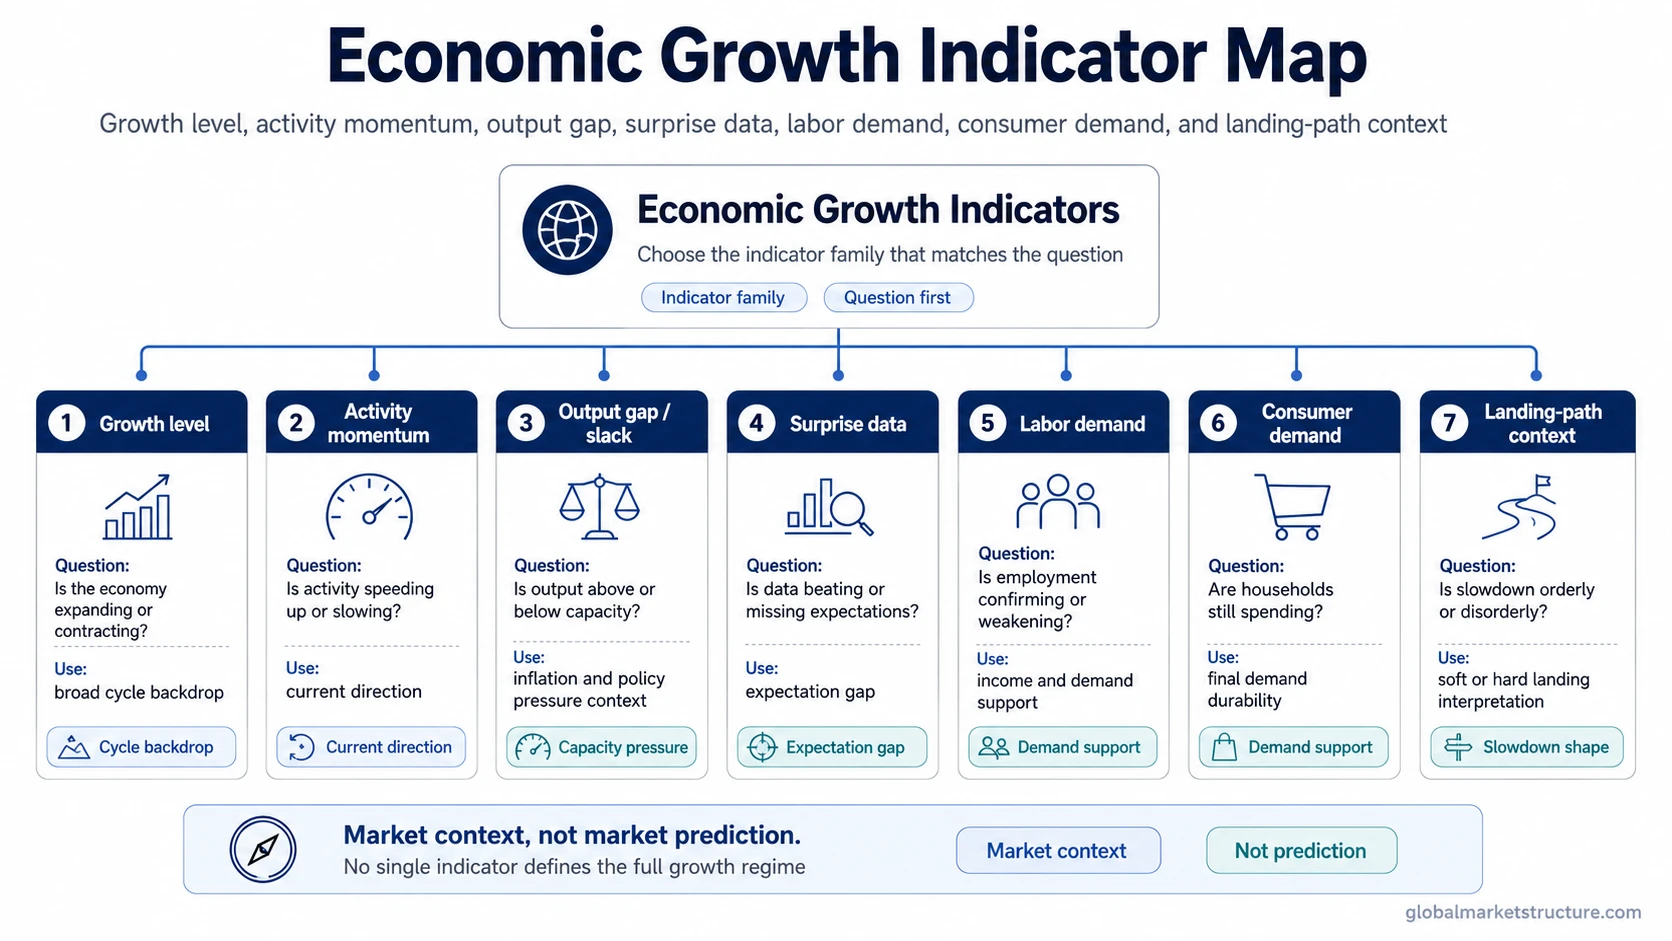
Economic growth indicators separate different questions about growth: how fast the economy is expanding, whether activity is accelerating or slowing, whether output is above or below capacity, whether data is surprising expectations, and whether labor or consumer demand still supports the cycle.
Core idea: no single growth indicator gives a complete market context. Growth level, activity momentum, slack, surveys, surprise data, labor demand, and consumer demand answer different questions.
Best use: treat growth indicators as a map of conditions, not as a direct forecast for asset prices or a standalone market signal.
For market interpretation, the useful starting point is the question being asked. A slow GDP release can help frame the level of economic growth, while faster survey or labor data may help identify whether the growth picture is changing before the full national accounts are visible.
Economic Growth Indicator Family Map
Growth indicators become clearer when grouped by function. Some indicators describe the level of activity. Others describe momentum, spare capacity, labor demand, household demand, or whether incoming data is beating or missing expectations.
| Indicator family | Main question | Market-context use |
|---|---|---|
| Growth level | Is the economy expanding or contracting? | Frames the broad cycle backdrop, but usually with a reporting lag. |
| Activity momentum | Is current activity speeding up or slowing down? | Helps detect directional change before slower aggregate data is complete. |
| Slack and capacity | Is output above or below potential? | Connects growth to inflation pressure, policy sensitivity, and cycle strain. |
| Survey direction | Are firms reporting stronger or weaker conditions? | Shows whether business activity is improving or deteriorating in real time. |
| Surprise data | Is the data better or worse than expected? | Separates the raw level of growth from the market’s expectation gap. |
| Labor demand | Is the labor market confirming or weakening? | Tests whether growth pressure is broad enough to support income and demand. |
| Consumer demand | Are households still spending? | Shows whether final demand is supporting the growth cycle. |
| Landing-path context | Is the slowdown orderly or disorderly? | Connects growth data to soft-landing or hard-landing interpretation without turning either into a prediction. |
Which Growth Indicator Fits the Market Question?
A growth indicator is useful only when it matches the question. The same data release can mean different things depending on whether the focus is growth level, momentum, spare capacity, market expectations, or demand durability.
| Reader question | Indicator family | What it helps interpret | Best related concept |
|---|---|---|---|
| Is the economy expanding or contracting? | Growth level | The broad direction and scale of economic activity. | Economic growth |
| Is activity accelerating or slowing? | Activity momentum and surveys | Whether business activity is improving or weakening before slower data is complete. | Purchasing managers index |
| Is the economy running above or below capacity? | Slack and capacity pressure | Whether demand is pressing against productive capacity or leaving spare capacity unused. | Output gap |
| Is data better or worse than expected? | Surprise data | The gap between reported data and market expectations. | Economic surprise index |
| Is labor demand confirming or weakening? | Labor market confirmation | Whether employment conditions support or undermine the growth picture. | Unemployment rate |
| Is household demand still supporting growth? | Consumption demand | Whether final demand remains resilient or is losing support. | Consumer spending |
| Is a slowdown orderly or disorderly? | Landing-path context | Whether weaker growth is still controlled or becoming sharper and more fragile. | Soft landing and hard landing |
| Is near-term growth changing before full GDP data arrives? | Nowcasting and high-frequency confirmation | Whether faster data points are shifting the near-term activity picture. | Growth nowcasting framework |
What Growth Indicators Can and Cannot Tell Markets
Growth indicators help classify the economic backdrop. They can show whether activity is expanding, slowing, surprising expectations, pressing against capacity, or weakening through labor and household demand. That makes them useful for market context, especially when they are compared with rates, inflation, credit, liquidity, and breadth.
Limit: growth data does not directly predict market direction. Strong growth can support earnings expectations, but it can also raise policy pressure if inflation risk is high. Weak growth can reduce rate pressure, but it can also increase credit and earnings risk if the slowdown becomes disorderly.
The interpretation becomes stronger when several independent indicators point in the same direction. It weakens when the data is mixed, revised, lagged, or concentrated in one part of the economy. A single headline release should not carry the entire macro view.
Illustrative Orientation Scenario
A market observer sees a strong headline growth number. The next question is not simply whether growth is “good.” If the focus is current momentum, a business survey such as PMI may matter more. If the focus is spare capacity, the output gap may be more relevant. If the focus is market reaction, surprise data may matter more than the raw growth level. If the focus is demand durability, labor and consumer spending data become more important.
This is why growth indicators work best as a sequence of questions. The growth level frames the cycle, momentum shows whether activity is changing, slack links growth to inflation pressure, surprise data explains expectation shifts, and demand indicators test whether the expansion is still supported by households and labor income.
Common False Reading
Common mistake: treating one strong or weak indicator as a complete macro regime signal. A positive PMI reading, a low unemployment rate, or firm consumer spending can each be useful, but none of them alone confirms the full growth environment.
Growth interpretation usually needs confirmation across more than one channel. Activity momentum may improve while consumer demand is fading. Labor data may look firm while surprise indexes are weakening. GDP may show past strength while current surveys are already slowing. The useful signal is the pattern across the indicator stack, not the most dramatic single release.
Where to Go Next
Use economic growth to frame the broad cycle backdrop, PMI for activity momentum, output gap for capacity pressure, and economic surprise index for the gap between data and expectations.
When the question shifts from activity to demand durability, unemployment rate and consumer spending help test whether labor income and household demand still support the cycle. When the question shifts to the shape of a slowdown, soft landing and hard landing separate a controlled deceleration from a sharper deterioration.
FAQ
Are economic growth indicators the same as economic indicators?
No. Economic indicators can include inflation, rates, credit, housing, trade, and financial conditions. Economic growth indicators focus more narrowly on output, activity momentum, capacity pressure, labor demand, consumer demand, and growth expectations.
Is GDP enough to understand growth for markets?
GDP is important for the broad growth level, but it is not enough on its own. Markets often react to momentum, expectations, revisions, labor demand, consumer demand, and whether growth is changing before full GDP data is available.
Are leading indicators always better than lagging indicators?
No. Leading indicators may help detect turning points earlier, but they can produce false signals. Lagging and coincident indicators can still matter because they confirm whether the broader economy has actually changed.
Can growth indicators predict market direction?
No single growth indicator can reliably predict market direction. Growth data is one part of market context and should be interpreted alongside inflation, policy, liquidity, credit, valuation, positioning, and breadth.