A diffusion index is a breadth-style indicator that measures how widely components in a dataset are improving, weakening, rising, or falling. Methods vary by provider and dataset, but the core purpose is to show whether change is concentrated in a few components or spread across many of them. A diffusion index usually captures direction or breadth, not the size of each change, and it is not a standalone market-timing, recession, policy, or buy/sell signal.
In market-cycle analysis, diffusion indexes are useful because they separate the distribution of change from the intensity of change. A broad improvement across many industries, survey responses, or economic sub-series can carry a different message than a large move in only one or two components. The index is therefore a breadth lens, not a complete cycle model.
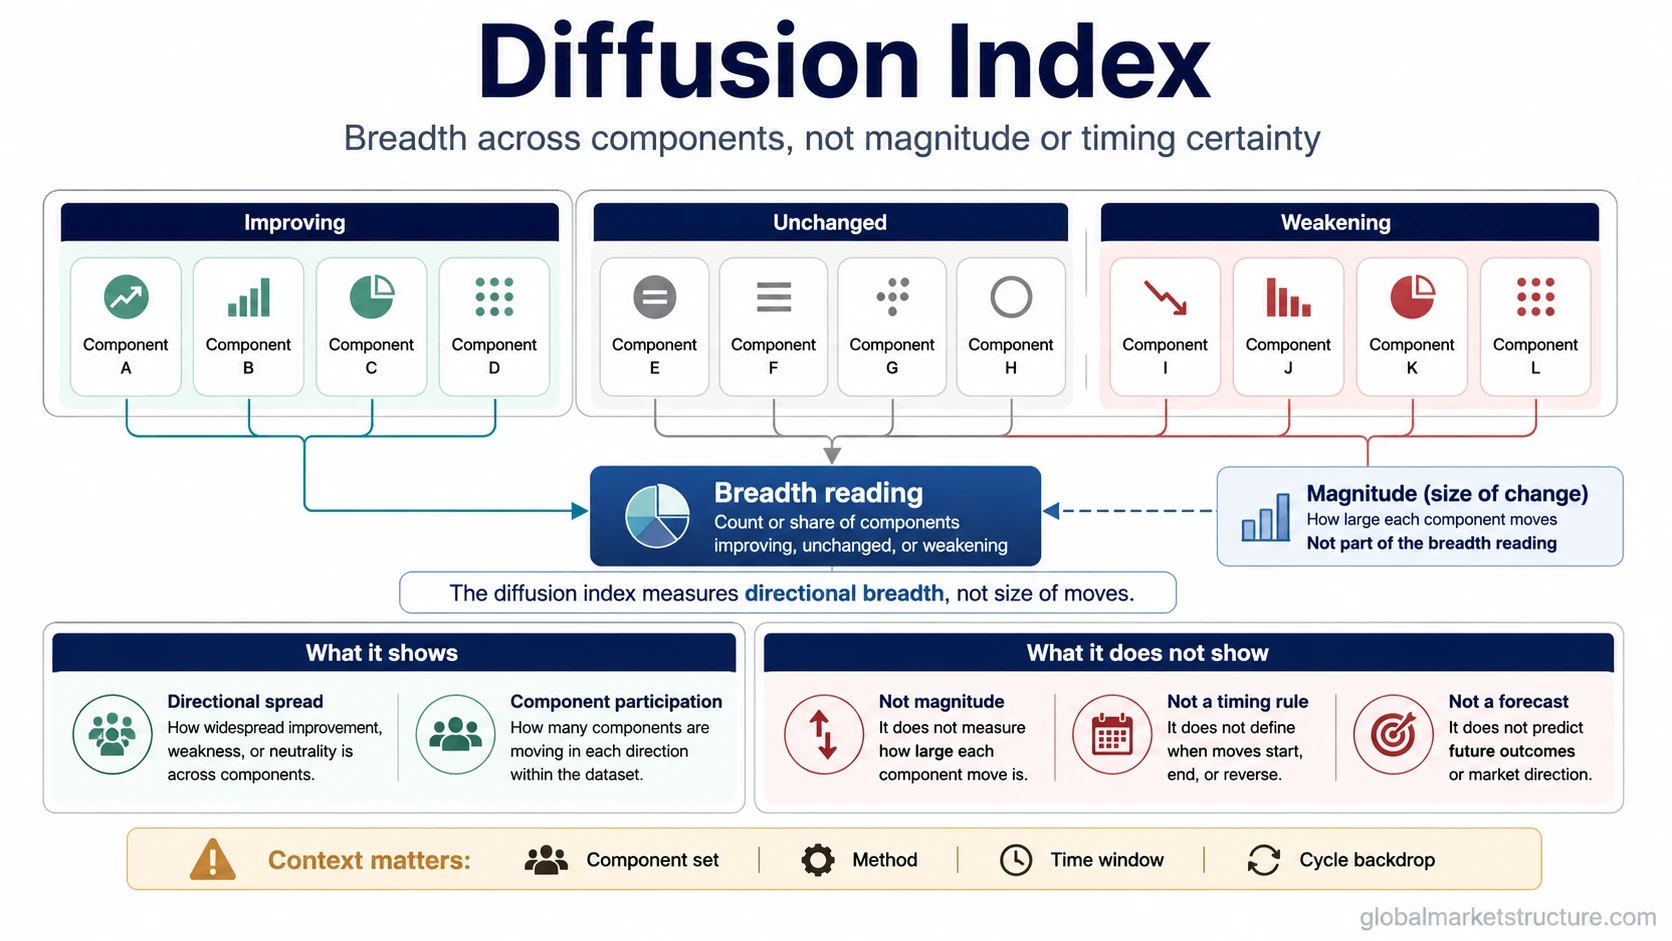
What a Diffusion Index Tells You
A diffusion index helps answer one narrow question: how widespread is the direction of change across the components being measured? It can show whether improvement, deterioration, expansion, contraction, increases, or decreases are broad or narrow inside a chosen dataset.
| It can tell you | It does not tell you by itself |
|---|---|
| Whether more components are improving than weakening. | How large each component’s improvement or decline is. |
| Whether a move is broad-based or concentrated. | Whether the economy or market has reached a turning point. |
| Whether breadth is strengthening or weakening across the measured group. | Whether the signal is early, current, or late in a cycle without other context. |
| Whether a component set is becoming more balanced or more one-sided. | Whether investors should buy, sell, hedge, or change allocation. |
The value of the reading depends on what the component set represents. A diffusion index built from employment industries, business survey responses, manufacturing categories, or market breadth inputs can have a different interpretation because the underlying components are different.
How Diffusion Indexes Are Commonly Constructed
Diffusion indexes do not all use one universal formula. Many versions classify each component as improving, unchanged, or weakening, then convert the balance into an index reading. A common approach gives full weight to components that increased, partial weight to components that were unchanged, and no weight to components that declined. Other providers may use different rules, time windows, component sets, or thresholds.
| Construction element | Why it changes interpretation |
|---|---|
| Component set | The reading depends on which industries, survey responses, sub-series, or market inputs are included. |
| Unchanged components | Some methods give partial weight to unchanged components, while others handle them differently. |
| Time window | One-month, multi-month, and release-specific methods can describe different kinds of breadth. |
| Threshold | A midpoint such as 50 can act as a balance level in some systems, but it is not universal across all diffusion indexes. |
Core construction idea: a diffusion index usually converts component-level direction into a single breadth reading. The exact scoring method depends on the provider, the dataset, and the purpose of the index.
A reading near the middle of the scale is often interpreted as a balance point in many diffusion-index systems, but that interpretation is not universal. The meaning of a threshold depends on the methodology. Some indexes use 50 as a dividing line, some use different baselines, and some require comparison with the index’s own history rather than a fixed universal level.
Breadth Is Different From Magnitude
The most important distinction is breadth versus magnitude. Breadth asks how many components are moving in a direction. Magnitude asks how far they are moving. A diffusion index is mainly designed for the first question.
Illustrative scenario: imagine a dataset with 100 industries. If 70 industries improve slightly and 30 weaken, a diffusion index may show broad improvement. If only 20 industries improve but those 20 rise sharply, the aggregate level of activity may still look strong in another measure. The diffusion index highlights how widely the improvement is distributed, not how large the total move is.
This distinction matters because market-cycle interpretation can become distorted when breadth and magnitude are blended together. A broad but small improvement can suggest participation is spreading. A narrow but large improvement can suggest concentration. Neither reading is automatically bullish or bearish without the surrounding macro, liquidity, credit, earnings, or risk-appetite context.
How Diffusion Indexes Support Market-Cycle Interpretation
Diffusion indexes can help identify whether a cycle signal is becoming broader or narrower. When more components begin moving in the same direction, the signal may look more internally consistent. When fewer components participate, the signal may look more fragile or concentrated.
For example, broad weakening across many components may indicate that deterioration is no longer isolated. Broad improvement may indicate that recovery or expansion pressure is spreading. The reading becomes more useful when combined with other evidence, such as credit conditions, liquidity, yields, inflation pressure, employment conditions, earnings breadth, or cross-asset behavior.
The index should remain an input, not a conclusion. A diffusion reading can support a market-cycle view, but it does not replace a broader framework for interpreting timing, causality, and risk.
Common False Reading
Common mistake: treating a diffusion index reading as a direct forecast. A high reading does not automatically mean strong future market returns, and a low reading does not automatically mean recession, market decline, or policy easing. The index reflects breadth inside its own component set, not a complete forecast of the economy or financial markets.
False readings can happen when the component set is narrow, when the methodology changes, when unchanged components receive special treatment, or when a few large components dominate another measure while the diffusion index gives each component similar directional weight. Interpretation starts with index design before any broader market conclusion becomes credible.
Diffusion Index vs Leading, Coincident, and Lagging Indicators
A diffusion index describes how widely change is distributed across components. Timing categories describe where an indicator tends to sit relative to a cycle. These are different classifications.
| Concept | Main question | How it differs from a diffusion index |
|---|---|---|
| Diffusion index | How broad is the change across components? | Focuses on breadth or distribution of direction across a component set. |
| Leading indicator | Does the signal tend to move before the broader cycle? | Focuses on timing relationship, not necessarily breadth across components. |
| Coincident indicator | Does the signal tend to move with the current cycle? | Focuses on current-cycle alignment rather than component participation. |
| Lagging indicator | Does the signal tend to move after the broader cycle has already changed? | Focuses on delayed confirmation rather than breadth across a dataset. |
A diffusion index can be applied to data that is early, current, or late depending on the underlying series. The diffusion method does not automatically make the indicator leading, coincident, or lagging.
Methodology and Data-Source Caveat
Diffusion indexes are often published by official institutions, data providers, and economic research organizations. Those sources may define component scoring, time windows, seasonal adjustment, and threshold interpretation differently. The safest interpretation starts with the source methodology before comparing one diffusion index with another.
For evergreen analysis, current readings should be handled carefully. A live value from an official data endpoint can become outdated quickly, and a dashboard reading may reflect a specific release date, vintage, or methodology. The more durable concept is the interpretation boundary: diffusion indexes summarize breadth across components, while other measures are needed to assess magnitude, timing, and market impact.
FAQ
What is a diffusion index?
A diffusion index is a breadth indicator that measures how widely components in a dataset are improving, weakening, rising, or falling. It summarizes component-level direction rather than the size of each component’s move.
How is a diffusion index calculated?
Many diffusion indexes classify components as increasing, unchanged, or decreasing, then convert those classifications into a single breadth reading. The exact formula, threshold, and time window depend on the provider and dataset.
Is a diffusion index a leading indicator?
Not automatically. A diffusion index measures breadth across components. Whether it is leading, coincident, or lagging depends on the underlying data series and how that series behaves relative to the cycle.
Does a diffusion index predict recessions?
No. A diffusion index can show broad deterioration or improvement, but it does not predict recessions by itself. It needs context from other economic, credit, liquidity, and market-cycle evidence.
Why can a diffusion index be misleading?
It can be misleading when the component set is narrow, the methodology is misunderstood, thresholds are treated as universal, or breadth is confused with magnitude. A broad directional reading does not show how large each underlying change is.