A coincident indicator is an economic indicator that tends to move with current or very recent economic activity. It helps confirm the present state of the business cycle rather than predict the next turning point. Employment, income, production, sales, and GDP-like measures can act as coincident readings, but publication lags and revisions limit real-time use. In market-structure work, the value is context, not a buy or sell signal.
What a coincident indicator means
A coincident indicator sits in the middle of the economic timing stack. It does not usually move far ahead of the economy, and it does not only confirm conditions long after they have changed. Its main role is to describe activity that is happening now or has recently happened.
That makes coincident data useful for checking whether the economy is still expanding, slowing, stabilizing, or weakening. The interpretation is strongest when several current-activity measures point in the same direction instead of relying on one release.
Core definition: a coincident indicator is a current-activity timing indicator. It can help confirm the present state of the business cycle, but it does not by itself forecast the next cycle turn.
How coincident indicators differ from leading and lagging indicators
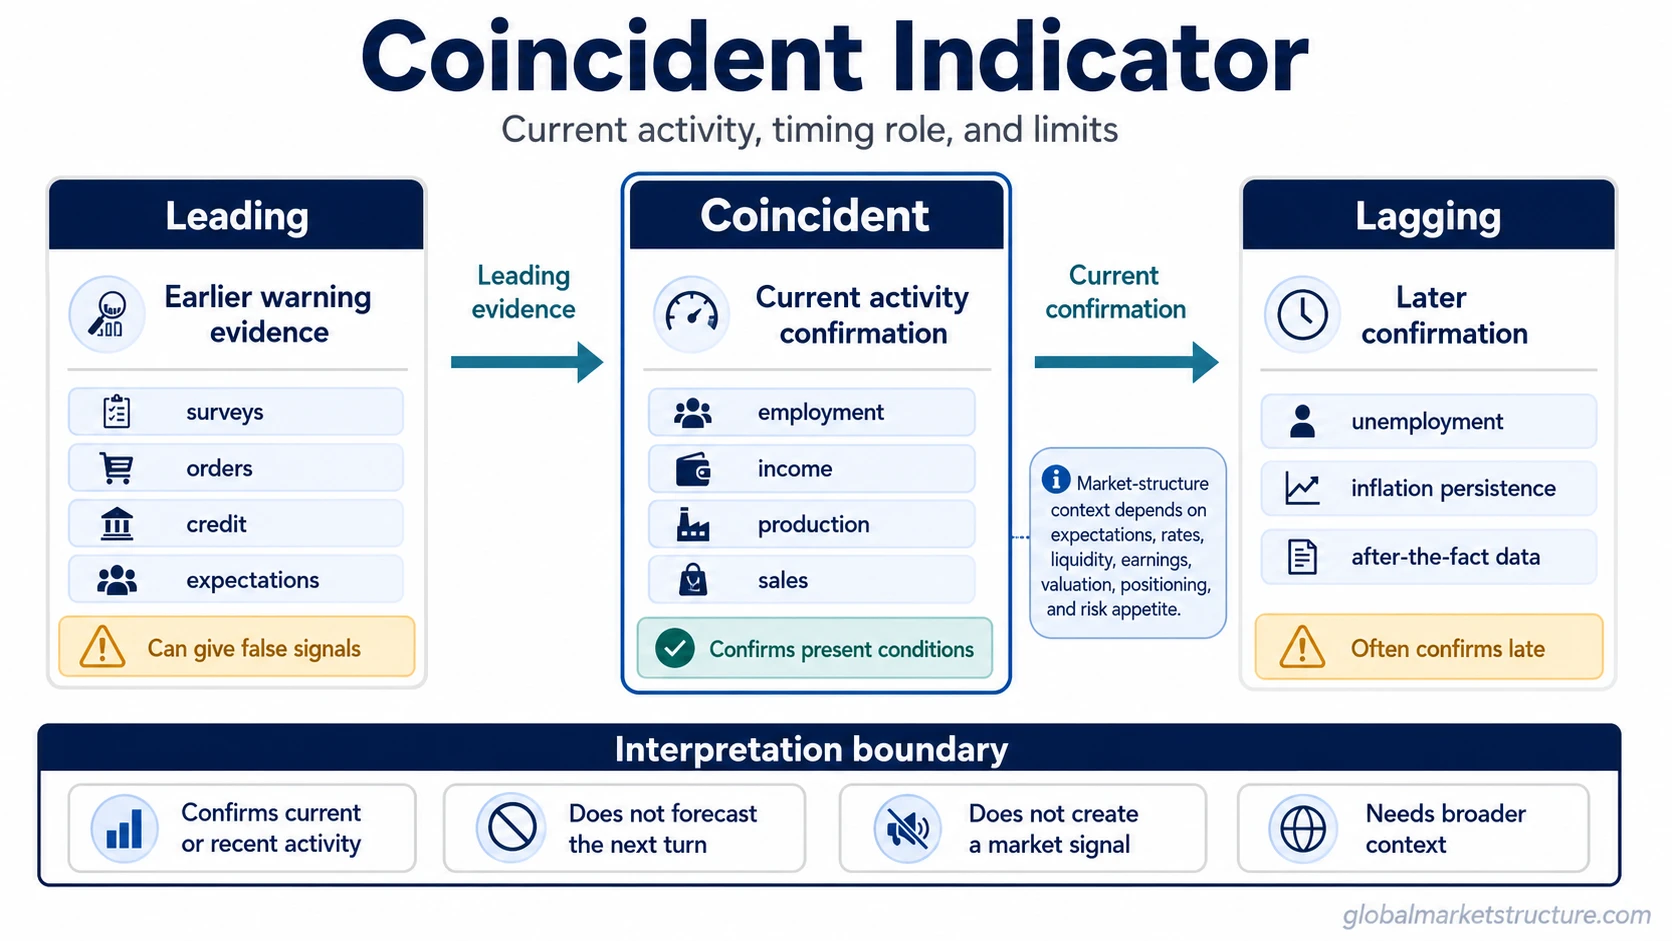
The difference between leading, coincident, and lagging indicators is mainly about timing. A leading indicator is watched for movement before broader activity changes. A coincident indicator moves with current or recent activity. A lagging indicator usually confirms after the shift has already appeared.
| Indicator type | Timing role | Typical use | Main limitation |
|---|---|---|---|
| Leading indicator | Moves before broader activity in many cycles | Early warning or early confirmation | Can produce false signals |
| Coincident indicator | Moves with current or recent activity | Current-state cycle confirmation | Can be lagged, revised, or already priced in |
| Lagging indicator | Moves after activity has already changed | After-the-fact confirmation | Often arrives too late for early interpretation |
The timing distinction matters because a coincident reading can confirm that conditions are firm or weak, but it should not be treated as proof that the next phase has already been identified.
Examples of coincident indicators
Common coincident indicators usually come from observed economic activity rather than expectations alone. They often include labor-market, income, production, sales, and broad output measures.
| Example area | What it can reflect | Interpretation boundary |
|---|---|---|
| Employment | Whether firms are still supporting current labor demand | Labor data can stay firm after early-cycle weakness has already appeared elsewhere |
| Income | Whether households have current spending support | Aggregate income can hide pressure across specific groups |
| Industrial production | Whether real activity is expanding or contracting in production-sensitive areas | Sector mix can matter more than the headline direction |
| Sales | Whether demand is still visible in current spending or business activity | Nominal sales can be influenced by price changes as well as volume |
| GDP-like measures | Broad current-activity conditions across the economy | Release delays and revisions make them less immediate than higher-frequency data |
Many coincident indicators are closer to hard data vs soft data because they come from observed activity. Surveys and expectations can still matter, but they often answer a different question: what participants expect, not only what activity has already occurred.
What coincident indicators can and cannot confirm
Coincident indicators are strongest when they are used as confirmation tools. They can clarify whether the current economic backdrop is still aligned with expansion, slowdown, contraction, or recovery. They become weaker when they are treated as standalone forecasts.
| Reading | Useful interpretation | Boundary |
|---|---|---|
| Current activity | Shows whether recent economic activity is firm, mixed, or weakening | Does not prove what activity will look like in the next phase |
| Cycle confirmation | Can support a current business-cycle assessment when several indicators align | Does not confirm the cycle phase with certainty |
| Policy and rate-expectation context | Can influence how markets interpret growth resilience, slowdown risk, and policy pressure | Does not prove what a central bank will do next |
| Market reaction | Can help explain why assets respond to macro data in a certain environment | Does not create a direct market signal |
| Turning-point prediction | Can confirm that conditions have already changed or are changing | Does not usually identify the next turning point by itself |
How coincident data fits market-structure interpretation
Coincident data becomes more useful when it is placed inside a broader evidence stack. The release itself is only the starting point. The market interpretation depends on what investors already expected, how rates and yields respond, whether liquidity is supportive or restrictive, and whether risk appetite confirms or rejects the data message.
Interpretation sequence:
- Hard data release: employment, income, production, sales, or output data becomes available.
- Current activity reading: the data suggests whether recent activity is firm, mixed, or weakening.
- Cycle-state confirmation: the reading is compared with other macro and market-cycle evidence.
- Policy and rate-expectation context: markets consider whether the data changes growth, inflation, or policy expectations.
- Market interpretation boundary: price reaction still depends on expectations, rates, liquidity, earnings, valuation, positioning, and risk appetite.
A strong coincident reading can support the idea that current activity remains resilient. It does not automatically mean growth will accelerate, recession risk has disappeared, or risk assets should move in one direction. A weak coincident reading can confirm pressure in current activity, but it does not automatically mean policy easing, recession timing, or a single asset-market outcome.
A practical scenario
Imagine that employment, income, and production data remain firm while some leading indicators have already softened. The coincident data can confirm that current activity has not yet broken down. That confirmation matters, but it does not erase the earlier warning signs. The cleaner interpretation is that the present economy is still holding up while forward-looking evidence remains under review.
The same logic works in reverse. Weak coincident data may confirm that pressure has reached current activity, but the market may have started discounting that risk earlier. By the time the coincident data is clear, part of the market adjustment may already have happened.
Limitations of coincident indicators
Reporting lag: many coincident indicators are published after the activity period has already passed. A current-activity reading can still arrive late for real-time market interpretation.
Revision risk: initial releases can be revised. A clean signal may become less clean after later data updates.
Backward-looking interpretation: coincident indicators describe current or recent activity. They do not have the same timing role as leading indicators.
Single-indicator risk: one strong or weak release can be misleading if other indicators, market behavior, liquidity conditions, and policy expectations do not confirm the same message.
Market-timing risk: coincident data can shape context, but it is not a direct timing tool for buying, selling, allocating, or forecasting asset returns.
Common mistakes when reading coincident indicators
Common mistakes include treating current activity as a forecast, ignoring publication lag, overreading GDP-like measures, turning macro confirmation into a market signal, and relying on one indicator without confirmation from broader cycle, market, liquidity, credit, and rates evidence.
Where coincident indicators sit in an indicator stack
A useful indicator stack separates early evidence, current confirmation, and after-the-fact confirmation. Leading indicators warn that conditions may be changing, coincident indicators show whether the change is appearing in current activity, and lagging indicators confirm after the shift is clearer. The stack works only when each timing role stays separate.
Related concepts
Related concepts include leading indicators, which belong earlier in the timing stack; lagging indicators, which confirm later; and the hard-data versus soft-data distinction, which helps separate observed activity from expectations-based readings.