
Implied vs realized volatility compares what options were pricing before a measurement window with what the underlying asset actually did during that window. Implied volatility is inferred from option prices and is forward-looking relative to the relevant contract horizon. Realized volatility is calculated from observed price movement. The comparison is cleanest when both measures refer to the same underlying and a comparable time horizon.
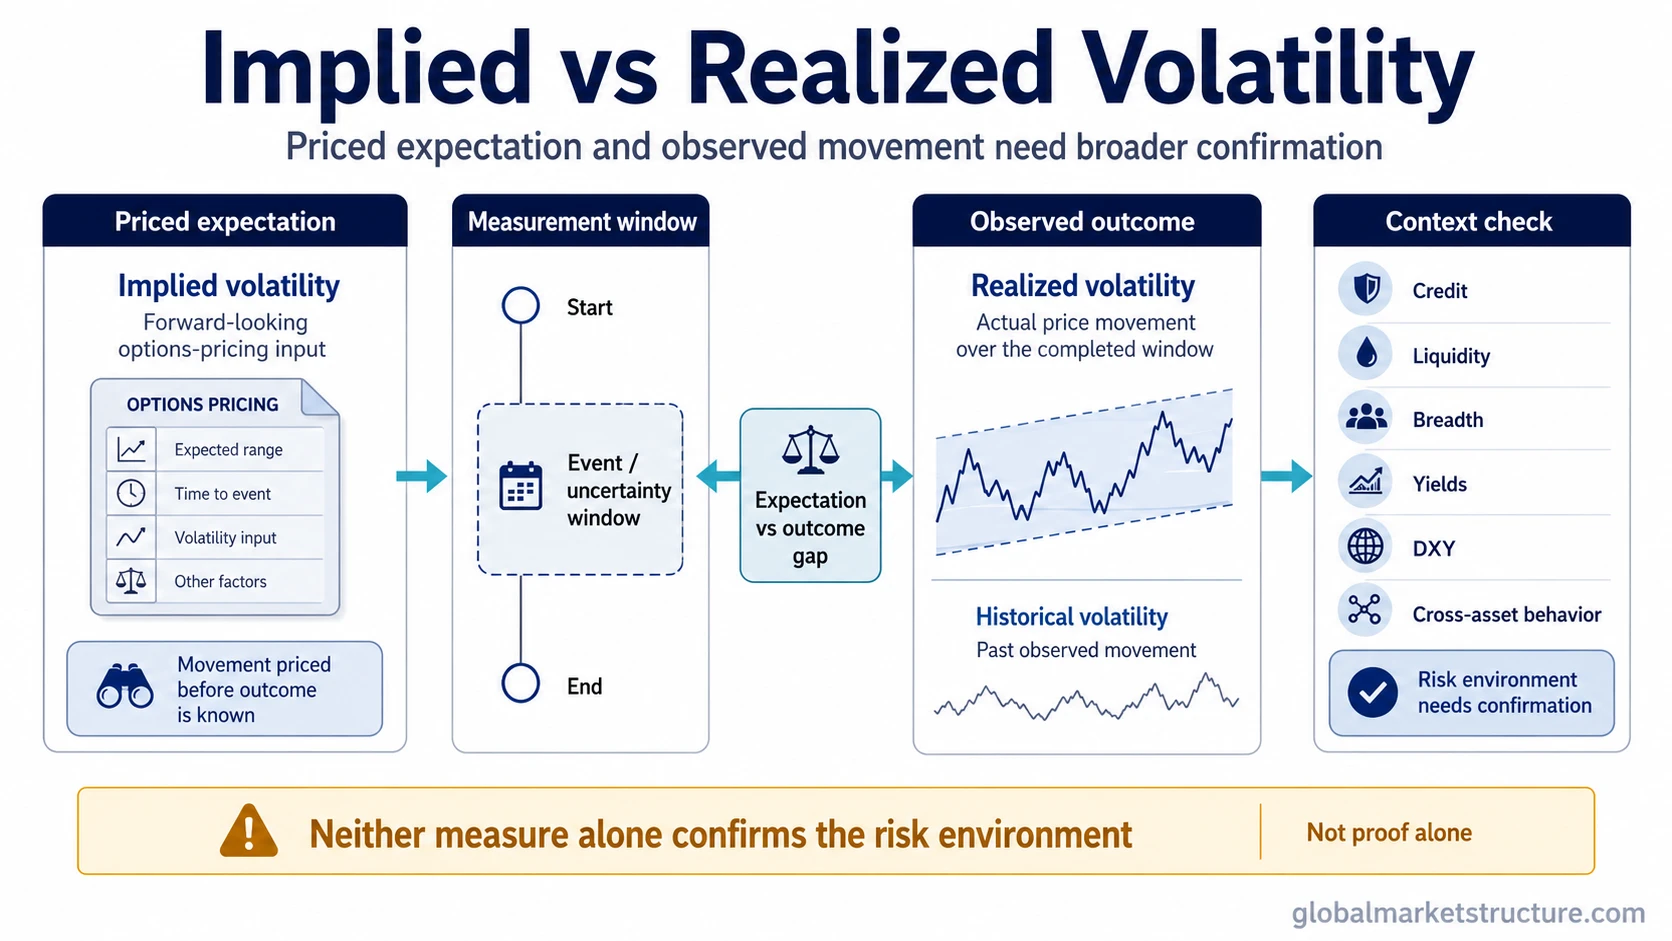
Implied vs Realized Volatility at a Glance
| Criteria | Implied volatility | Realized volatility |
|---|---|---|
| Core question | How much future movement is being priced through options? | How much movement actually occurred? |
| Time orientation | Observed before the future price path is known. | Calculated after returns have been observed over the measurement window. |
| Source | Option prices and the inputs used to interpret those prices. | Observed price returns over a defined period. |
| Measurement horizon | Linked to the horizon represented by the option or volatility measure. | Should use a corresponding realized window when the two measures are being compared directly. |
| What it provides | A market-implied volatility estimate before the outcome. | A volatility estimate based on the movement that occurred. |
| Main comparison use | Compare priced expectation with the subsequent observed outcome under a consistent measurement frame. | |
| Deeper concept | Implied volatility | Realized volatility |
Comparing the Same Measurement Window
The comparison changes if the horizons do not line up. An implied reading taken before a future period belongs with realized volatility measured over the corresponding subsequent period. Comparing it with an unrelated historical window answers a different question.
Realized-volatility methodology matters as well. Sampling frequency, estimator choice, measurement window, and annualization can change the reported number even when the underlying price path is the same. Those choices should be defined before interpreting the size of an implied-versus-realized gap.
What Implied Volatility Measures
Implied volatility is inferred from option prices before the future price path is known. The reading depends on the option contract, market inputs, and the pricing framework used to translate an option price into a volatility estimate.
Its analytical role in this comparison is narrow: it records the volatility being priced for a future horizon. The detailed behavior of implied volatility across strikes, expirations, and option structures belongs to the separate entity page.
What Realized Volatility Measures
Realized volatility is calculated from price movement observed over a defined window. Once that window has passed, the result can be compared with the volatility that was priced beforehand.
Historical volatility is often used for backward-looking volatility estimates as well. The terminology can overlap in ordinary usage, although exact definitions depend on the measurement convention. For this comparison, the relevant realized measure is the one aligned with the period represented by the earlier implied reading.
Why Implied and Realized Volatility Can Diverge
Option prices can reflect a wide distribution of possible outcomes before an event or uncertainty window closes. The path that eventually occurs is only one realization from that range. Actual movement can therefore finish below, near, or above the volatility that had been implied beforehand.
A difference between the two numbers is useful information, but the size of the difference has to be read in the context of the contract, horizon, and realized-volatility methodology. Otherwise, part of the apparent gap may come from comparing different measurement frames rather than from the market pricing the same period differently.
Same Scenario, Different Meaning
- Option prices are already observable.
- Implied volatility expresses the volatility embedded in those prices for the relevant future horizon.
- The realized movement for that future window is still unknown.
- The underlying price path has been observed.
- Realized volatility can be calculated from the returns inside the corresponding period.
- The earlier implied reading can now be compared with the observed outcome on the same measurement frame.
How the Comparison Fits Risk-Environment Analysis
The context panel in the figure is deliberately separate from the central implied-versus-realized comparison. Credit, liquidity, breadth, yields, DXY, and cross-asset behavior can change how a volatility gap is interpreted, but they are not part of the volatility measurement itself.
This separation matters when markets are under pressure. A large gap can coexist with calm credit and functional liquidity, or it can appear while stress spreads across several channels. The first observation is the volatility comparison. The broader market conclusion requires additional evidence.
Implied volatility above subsequent realized volatility does not by itself establish mispricing, a repeatable trading edge, or broader market stress. Realized volatility above the earlier implied reading shows that observed movement exceeded the prior implied estimate under the chosen frame, but it does not establish direction, persistence, or a regime change.