
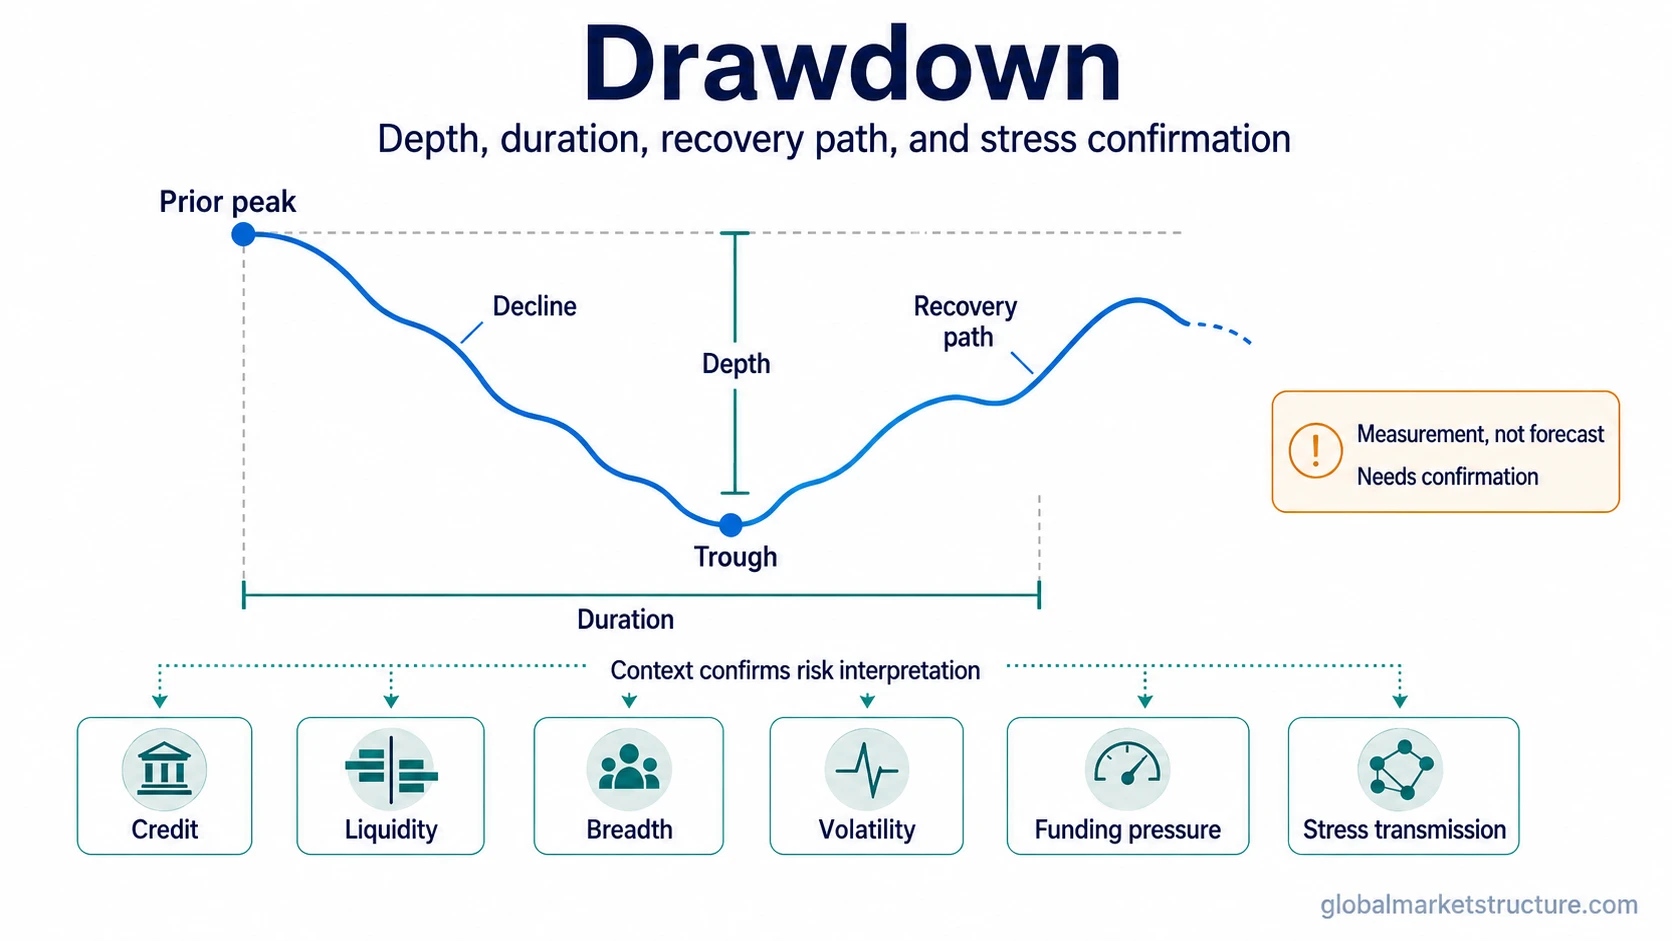
Drawdown is the decline from a prior peak to a later trough in an asset price, index, portfolio, strategy, or other financial variable. Its depth shows the size of the decline, while duration and the recovery path describe how long the value remains below its previous high. In market-risk analysis, the surrounding credit, liquidity, breadth, volatility, and funding conditions help establish what the decline may represent.
How drawdown is calculated
Drawdown is normally expressed as a percentage of the previous peak. The peak is the reference high, and the trough is the lowest subsequent value within the measured decline.
Drawdown (%) = (Peak value − Trough value) / Peak value × 100
If an index falls from 100 to 80, its drawdown is 20%. A return from 80 to the previous peak of 100 requires a 25% gain from the trough.
While a decline is still developing, the current drawdown can be measured from the prior high to the latest value. The final trough is established retrospectively, after a subsequent low has been identified.
Maximum drawdown is the largest peak-to-trough decline observed over a defined measurement period. That period and the frequency of observations matter. A monthly series, for example, may miss a deeper decline that occurred between the recorded observations.
Depth, duration, and recovery
Two markets can experience the same percentage decline and follow very different paths. One may fall sharply and recover within weeks. Another may spend months below its previous high after a similar decline. The loss depth is the same, but the time required to regain the peak differs.
| Dimension | What it measures | What to check |
|---|---|---|
| Depth | The percentage decline from the reference peak. | The peak used and the lowest subsequent value. |
| Time to trough | The interval between the peak and the later low. | Whether the decline developed quickly or over an extended period. |
| Underwater duration | The time spent below the previous peak. | Whether the old high has been regained. If it has not, the duration remains open. |
| Recovery path | The movement after the trough, including partial recovery, sideways trading, or a return to the prior peak. | How the recovery develops and whether it remains incomplete. |
| Maximum drawdown | The deepest observed peak-to-trough decline within the selected period. | The observation window and measurement frequency. |
The observation period and sampling frequency affect the drawdown measured for an index, portfolio, or strategy. CFA Institute discusses this measurement issue in its analysis of maximum drawdown and portfolio risk. Read the CFA Institute analysis.
MSCI examined 34 U.S. equity-market drawdowns exceeding 10% between 1946 and August 2024. The research compares maximum decline, time to bottom, and recovery time across retrospectively classified event categories. Historical differences in these paths help explain why drawdown depth alone is insufficient to characterize a decline. They do not establish the cause or future recovery path of an ongoing drawdown. Read the MSCI research.
Drawdown versus nearby risk concepts
The observed decline is only one part of a broader risk assessment. Other measures describe variability, loss recognition, selling pressure, or the transmission of stress.
| Concept | How it differs from drawdown |
|---|---|
| Realized loss | A portfolio can be below its previous peak before its loss is realized through a sale. Drawdown describes the value path, including unrealized declines. |
| Volatility | Volatility measures variability in returns or prices. Drawdown records the decline relative to an earlier high. Volatility may subside while the market remains below that high. |
| Financial contagion | Drawdown records the decline. financial-contagion concerns the transmission of stress across markets, institutions, regions, or funding channels. |
| Forced selling | A decline can reflect ordinary repricing. A fire-sale involves pressure-driven selling under liquidity or funding constraints, potentially affecting prices beyond normal repricing. |
| Systemic risk | A market decline may accompany wider financial instability. Assessing systemic risk requires evidence of financial-system disruption or the transmission and amplification of stress beyond the initial market move. |
Why the same drawdown can have different risk implications
Consider two broad equity indices that each fall 15% from their previous highs. Their drawdown depth is identical. The surrounding conditions and subsequent recovery paths, however, can differ substantially.
- Credit spreads remain relatively stable.
- Market liquidity continues to function without clear funding pressure.
- Breadth weakens, but the deterioration is limited.
- The index begins recovering without broader stress transmission.
The surrounding evidence is consistent with a more contained decline, although the eventual recovery remains uncertain.
- Credit spreads widen as the index declines.
- Liquidity weakens and funding pressure increases.
- Participation deteriorates across more of the market.
- Volatility rises while stress appears in connected markets.
The same 15% decline now coincides with evidence of a wider deterioration in the risk environment.
These are illustrative conditions, not classifications that can be inferred from the drawdown percentage alone. The relevant evidence depends on the market, measurement period, and available stress indicators.
A deeper or longer decline does not, by itself, establish forced selling, contagion, systemic risk, or a coming crash. Nor does it provide a buy, sell, or recovery signal. Those interpretations require separate evidence about market conditions, the mechanism behind the decline, and the applicable analytical horizon.