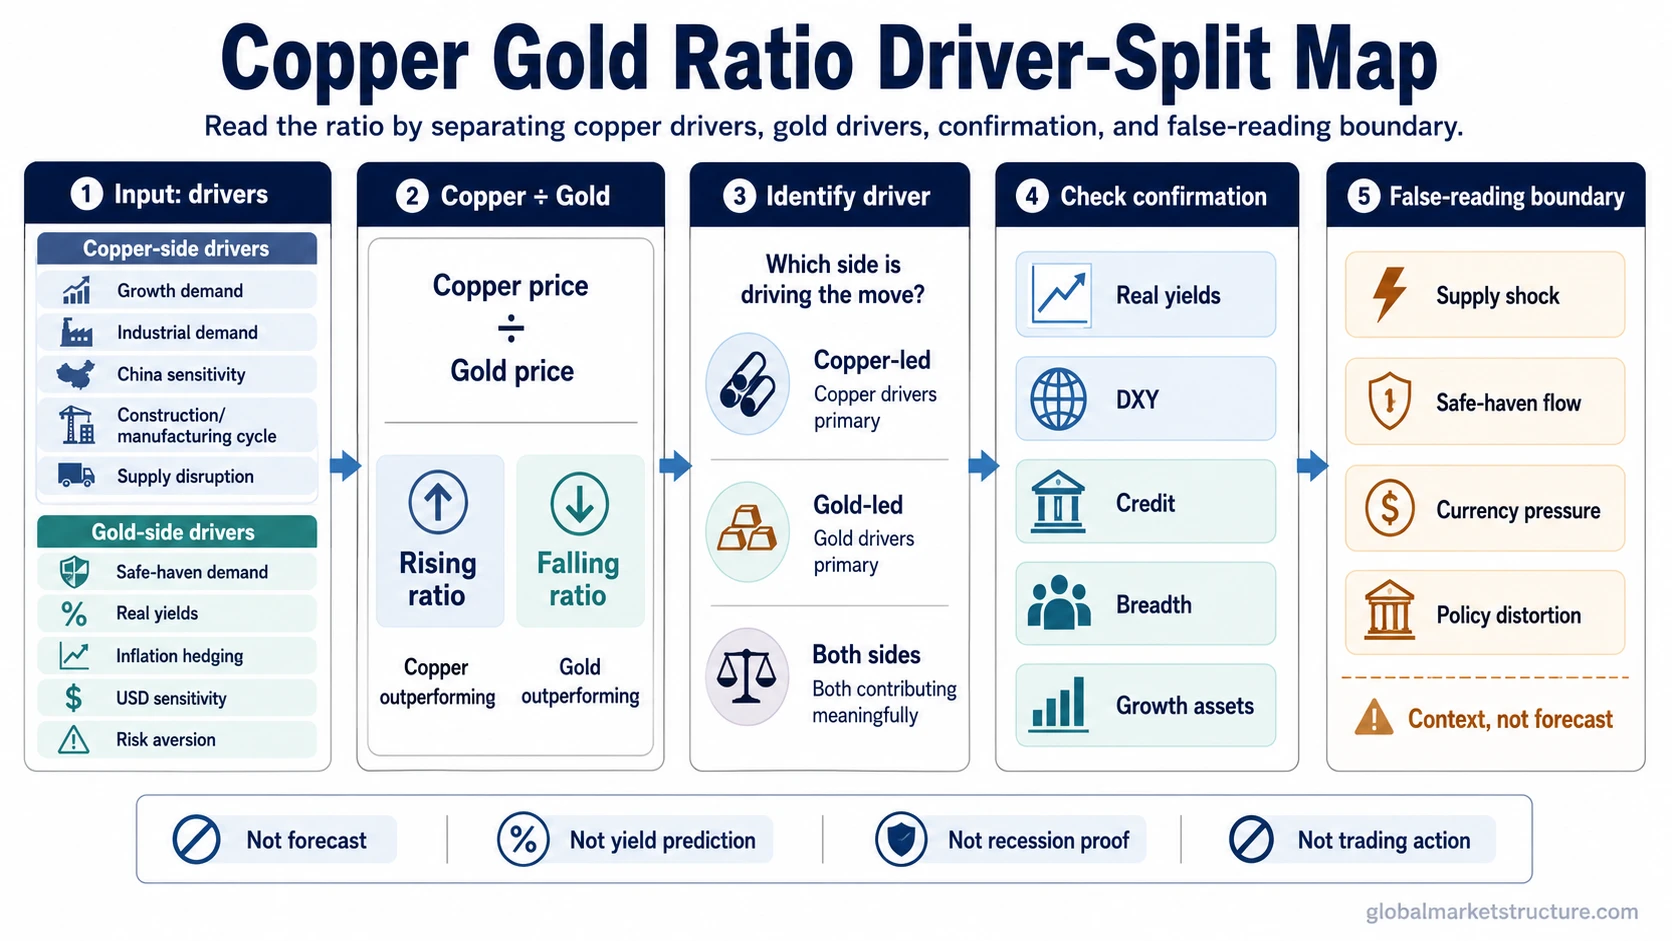
The copper gold ratio compares copper with gold to show which metal is outperforming. Copper is usually more tied to industrial demand and cyclical activity, while gold is more tied to defensive demand, monetary conditions, real yields, currency confidence, and safe-haven flows. A rising or falling ratio can help frame macro context, but it is not a standalone forecast, recession signal, yield predictor, or trading signal.
Definition: The copper gold ratio is a relative-price measure that compares the price of copper with the price of gold.
Basic formula: Copper gold ratio = copper price divided by gold price.
Core reading: A rising ratio means copper is outperforming gold. A falling ratio means gold is outperforming copper. The macro meaning depends on which side of the ratio is driving the move.
Key Points
- The copper gold ratio is a relative measure, not an economic forecast by itself.
- Copper outperformance can point to stronger cyclical pressure, but it can also reflect supply constraints or commodity-specific demand.
- Gold outperformance can reflect defensive demand, falling real yields, currency stress, or gold-specific flows.
- The ratio becomes more useful when checked against real yields, DXY, credit conditions, commodity breadth, and growth-sensitive assets.
- The main mistake is reading the ratio direction before identifying whether copper, gold, or both are driving the change.
What the Copper Gold Ratio Measures
The copper gold ratio measures relative performance between two metals that often respond to different macro forces. Copper tends to be more exposed to real-economy demand because it is used in construction, manufacturing, electrical systems, infrastructure, and power-related activity. Gold tends to behave more like a monetary and defensive asset, especially when investors focus on real yields, currency confidence, geopolitical stress, or reserve-like stores of value.
The ratio compresses two different macro stories into one relative line. That compression is also the source of the risk. A ratio can rise because copper is strong, because gold is weak, or because both are moving in opposite directions. A ratio can fall because copper is weak, because gold is strong, or because gold is rising faster than copper even while copper demand remains stable.
The current ratio level still needs a live chart or data source. The analytical value comes from interpreting the driver split, not from replacing a price chart, quote provider, or data terminal.
How Rising and Falling Copper Gold Ratio Readings Are Interpreted
A rising copper gold ratio usually means copper is outperforming gold. In macro interpretation, that can suggest stronger cyclical demand, firmer industrial activity, or better risk appetite. The reading is stronger when other growth-sensitive markets confirm the same message.
A falling copper gold ratio usually means gold is outperforming copper. That can suggest weaker cyclical pressure, rising defensive demand, lower real-yield pressure on gold, or concern about the broader risk environment. The reading is less reliable if the move is mainly caused by a gold-specific flow rather than by copper weakness.
| Ratio behavior | Basic relative reading | Possible macro interpretation | What must be checked |
|---|---|---|---|
| Rising copper gold ratio | Copper is outperforming gold. | Cyclical pressure may be improving, or defensive gold demand may be fading. | Whether copper strength is demand-led, supply-led, or simply gold weakness. |
| Falling copper gold ratio | Gold is outperforming copper. | Defensive pressure may be rising, or industrial demand may be weakening. | Whether the move comes from copper weakness, gold strength, real yields, DXY, or safe-haven demand. |
| Sideways or unstable ratio | Neither side is sending a clean relative message. | Macro interpretation may be mixed or unresolved. | Whether other cross-asset signals give a clearer message. |
Copper-Side Drivers
Copper strength is often interpreted as a growth-sensitive signal because copper demand is linked to industrial activity. That interpretation is useful, but incomplete without checking why copper is moving.
Copper can rise because demand expectations improve. It can also rise because inventories are tight, supply is constrained, electrification demand is being priced in, or commodity investors are repricing a broader metals cycle. Those drivers do not all carry the same macro meaning.
| Copper-side driver | Why it can lift copper | Macro reading risk |
|---|---|---|
| Industrial demand | Manufacturing, construction, infrastructure, and power demand can support copper pricing. | This can support a growth-sensitive reading, but only if confirmed by broader activity data and risk assets. |
| Supply constraints | Mine disruptions, inventory tightness, or production bottlenecks can lift copper even without stronger demand. | A supply-led copper move can overstate the growth message in the ratio. |
| Structural demand | Electrification and grid-related demand can support long-horizon copper narratives. | Structural demand is not the same as near-term cyclical acceleration. |
| Commodity-cycle repricing | Broader commodity strength can pull copper higher as part of a metals basket. | The move may reflect commodity allocation rather than a clean copper-specific growth signal. |
Gold-Side Drivers
Gold can change the copper gold ratio even when copper is not sending a strong message. This is why gold-side drivers matter as much as copper-side drivers.
Gold may strengthen when real yields fall, when investors seek defensive exposure, when currency confidence weakens, or when geopolitical and policy uncertainty increases. Gold may also move because of reserve demand or portfolio hedging demand. These forces can pull the copper gold ratio lower without proving that industrial demand has collapsed.
Gold-side interpretation is especially important when the ratio is compared with real yields and gold. Gold can respond to the real-rate environment in ways that distort a simple growth-versus-defense reading.
| Gold-side driver | Why it can lift gold | Macro reading risk |
|---|---|---|
| Real-yield pressure | Lower real yields can reduce the opportunity cost of holding gold. | A falling ratio may reflect rate conditions more than industrial weakness. |
| Safe-haven demand | Investors may seek defensive assets during stress or uncertainty. | Gold strength can make the ratio look defensive even if copper demand is stable. |
| Dollar and currency confidence | Changes in dollar pressure or currency confidence can affect gold demand. | The ratio may need to be checked against the gold-dollar relationship before assigning a growth reading. |
| Reserve and portfolio demand | Gold can attract strategic demand independent of the business cycle. | A gold-led ratio decline can be mistaken for a recession signal if the driver is not separated. |
Ratio Reading Versus False Reading
The main information gain in the copper gold ratio comes from separating the numerator and denominator before assigning macro meaning. A ratio move is not a cause. It is a relative outcome that must be decomposed.
| Observed ratio move | Possible driver | Safer interpretation | False-reading boundary |
|---|---|---|---|
| Ratio rises sharply | Copper rises while gold is flat or weaker. | Cyclical pressure may be improving if other growth-sensitive signals confirm. | Do not call it a growth signal if copper is rising mainly because of supply constraints. |
| Ratio rises because gold falls | Gold weakens while copper is stable. | The move may reflect less demand for defensive or monetary exposure. | Do not read it as strong industrial demand without copper-side confirmation. |
| Ratio falls sharply | Gold rises faster than copper. | Defensive, real-yield, currency, or policy pressure may be dominating. | Do not call it a recession signal unless growth, credit, and breadth data confirm stress. |
| Ratio falls because copper drops | Copper weakens while gold is stable. | Industrial demand expectations may be weakening. | Check whether the move is copper-specific, supply-related, or part of broader commodity weakness. |
| Ratio diverges from yields or equities | Gold, copper, rates, and risk assets are sending different messages. | The macro reading is mixed and needs confirmation. | Do not force the ratio to override other intermarket evidence. |
Interpretation boundary: The copper gold ratio is strongest as context when its message agrees with real yields, DXY, credit spreads, commodity breadth, and growth-sensitive assets. It is weakest when one side of the ratio is being driven by a metal-specific flow, a supply shock, a currency move, or a defensive portfolio shift.
How to Use the Ratio Inside a Broader Macro Check
The copper gold ratio becomes more useful when it is placed inside a broader intermarket check. A growth-sensitive interpretation is stronger when copper outperformance appears alongside firm commodity breadth, stable credit, resilient equity breadth, and risk appetite in other cyclical assets.
A defensive interpretation is stronger when gold outperformance appears alongside wider credit spreads, weaker market breadth, rising demand for defensive assets, or tighter financial conditions. If the dollar is moving strongly, the DXY Index can help separate dollar pressure from commodity-specific signals.
The ratio should not be used as a shortcut for a full macro view. It is one intermarket clue. The stronger process is to ask what is moving, why it is moving, and whether other markets confirm the same message.
Practical Scenario
Gold rises quickly while copper stays mostly stable. The copper gold ratio falls, so the first impression may be that the market is warning about weaker growth. That reading is possible, but it is not automatic. If the gold move is linked to lower real yields, currency stress, or defensive portfolio demand, the ratio may be showing gold-specific pressure rather than a broad collapse in industrial demand.
The safer interpretation is to separate the move into two questions: did copper weaken, and did gold strengthen for a reason that belongs to the business cycle? If copper is stable and credit conditions are calm, the falling ratio is a cautionary macro input, not a complete risk-off conclusion.
Related Concepts
The copper gold ratio can overlap with broader commodity and real-asset themes, but it should not replace those topics. A broad, long-duration commodity regime belongs under commodity supercycle, not inside a single ratio reading.
Gold and copper can also sit inside a wider real assets discussion when the question is about inflation-sensitive assets, commodity exposure, and stores of value. The copper gold ratio is narrower: it compares one growth-sensitive metal with one defensive and monetary metal.
FAQ
What does the copper gold ratio show?
It shows the relative performance of copper versus gold. A rising ratio means copper is outperforming gold, while a falling ratio means gold is outperforming copper. The interpretation depends on which metal is driving the move.
Does a rising copper gold ratio always mean stronger growth?
No. A rising ratio can suggest stronger cyclical pressure, but copper can also rise because of supply constraints, inventory tightness, or commodity-cycle repricing. The growth reading needs confirmation from other macro and market signals.
Does a falling copper gold ratio mean recession?
No. A falling ratio can reflect weaker copper, stronger gold, or both. Gold can rise for real-yield, currency, policy, or safe-haven reasons even when copper demand is not collapsing.
Is the copper gold ratio a trading signal?
No. It is an intermarket context indicator. It can help frame macro conditions, but it does not provide entries, exits, targets, or a standalone market forecast.