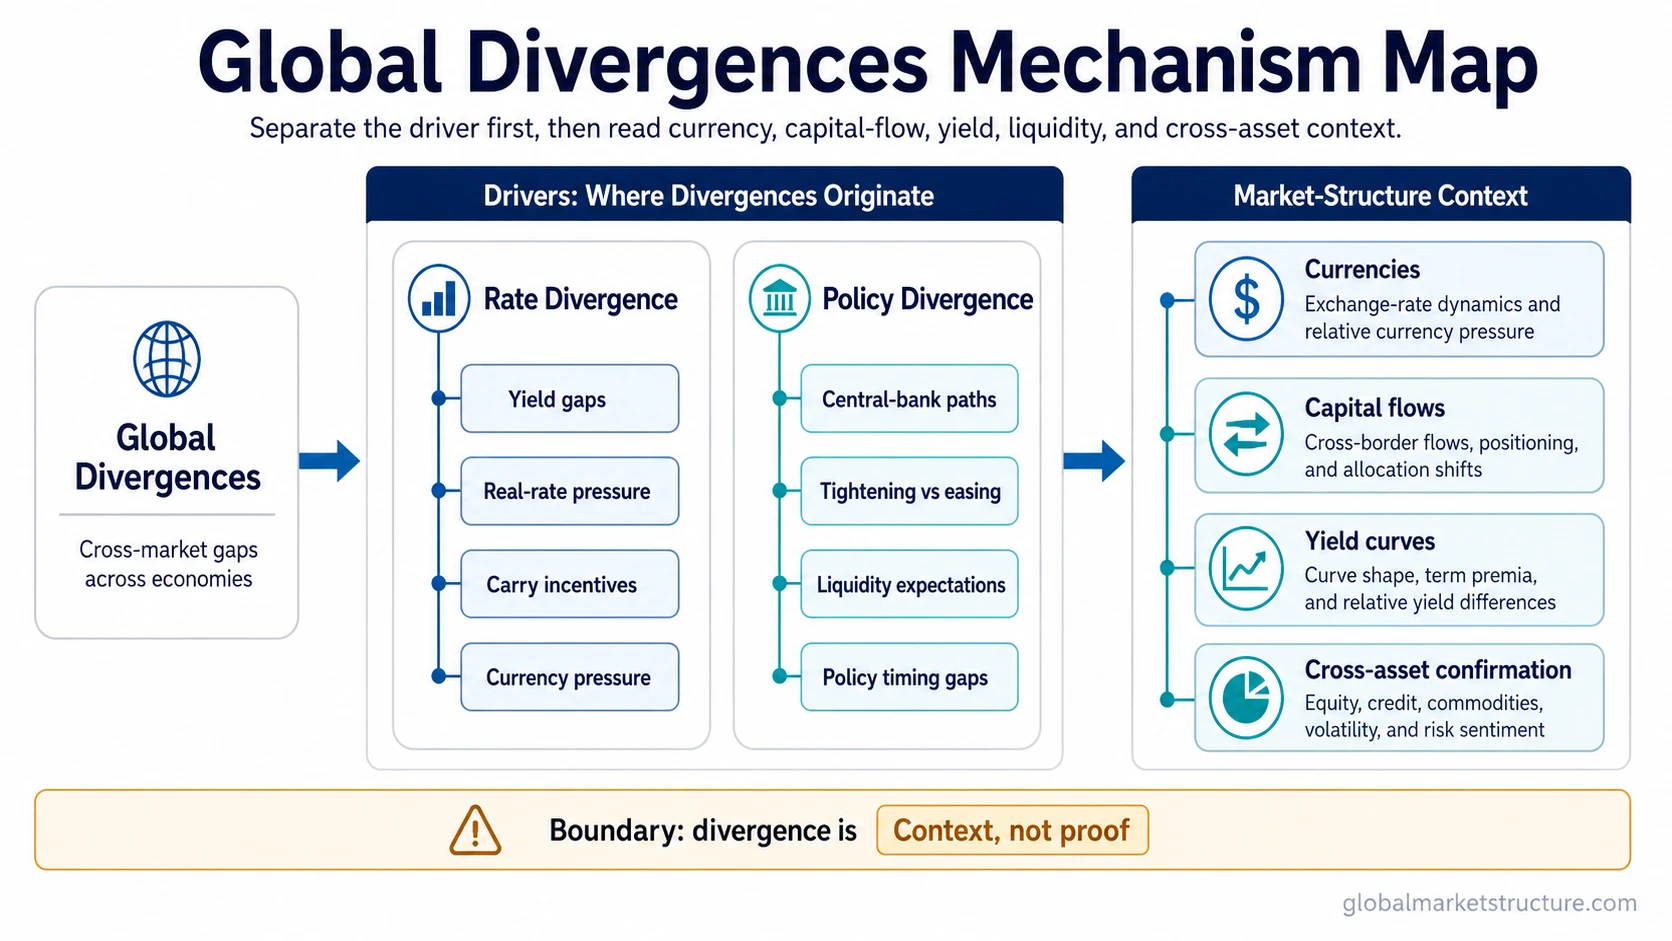
Global divergences are cross-market gaps between rates, policy paths, yield curves, currencies, capital flows, and risk behavior across major economies. The useful reading is not the divergence alone, but whether it reveals pressure, transmission, or confirmation across markets. The first distinction is the driver: rate gaps, policy-path gaps, currency pressure, or capital-flow behavior can point to different market-structure mechanisms.
Core Global Divergence Types
Global divergences become clearer when the underlying driver is separated first. A rate gap, policy-path gap, or currency pressure point may look similar on the surface, but each can reflect a different market-structure mechanism.
| Reader question | Primary concept | Use this concept when |
|---|---|---|
| How do cross-country rate gaps affect FX pressure, carry incentives, and capital flows? | Interest Rate Divergence | The main question is about yield gaps, rate differentials, duration pressure, or relative return incentives. |
| How do central-bank paths diverge across economies? | Monetary Policy Divergence | The main question is about different policy paths, tightening cycles, easing cycles, or central-bank reaction functions. |
Global Divergences in Intermarket Analysis
Global divergences belong inside intermarket analysis because they connect relative market pressure across economies. A divergence may appear through short-term rates, long-term yields, real yields, nominal yields, currency moves, or capital-flow behavior.
The cleanest interpretation separates the type of divergence before expanding the analysis. Rate-driven divergence belongs with yield gaps and return incentives, while policy-driven divergence belongs with central-bank paths, expected tightening or easing, and liquidity expectations.
How the Driver Changes the Interpretation
Start with the driver. If the driver is a yield or rate gap, the cleaner frame is interest-rate divergence. If the driver is a central-bank path, the cleaner frame is monetary-policy divergence.
Then check the transmission channel. Rate gaps often matter through currency pressure, carry incentives, discount-rate differences, and capital-flow sensitivity. Policy gaps often matter through expected rate paths, liquidity expectations, and relative macro pressure.
Keep currency and capital-flow readings in context. A currency move can reflect rate differentials, policy expectations, growth concerns, terms-of-trade pressure, positioning, or temporary risk appetite. The label should follow the dominant mechanism, not the most visible market move.
What Divergence Does Not Prove
Divergence does not prove a forecast, confirm a risk regime, or create a market call by itself. The interpretation becomes more useful when the divergence is consistent with surrounding evidence such as yield-curve behavior, real-yield pressure, credit conditions, liquidity context, currency behavior, and cross-asset confirmation.
A weak divergence reading usually has one of three problems: the driver is unclear, the transmission channel is mixed, or the surrounding market context does not confirm the pressure. In that case, the safer conclusion is uncertainty, not a stronger claim.
Adjacent Divergence Concepts
Rate divergence is the cleaner frame when the main pressure comes from relative yields, real rates, nominal rates, or cross-country return differences. Policy divergence is the cleaner frame when the main pressure comes from central-bank timing, expected easing or tightening, or policy-path separation.
Growth divergence, currency divergence, capital rotation, and divergence closure can describe surrounding context, but they should remain secondary unless the dominant mechanism is clearly different from rates or policy.